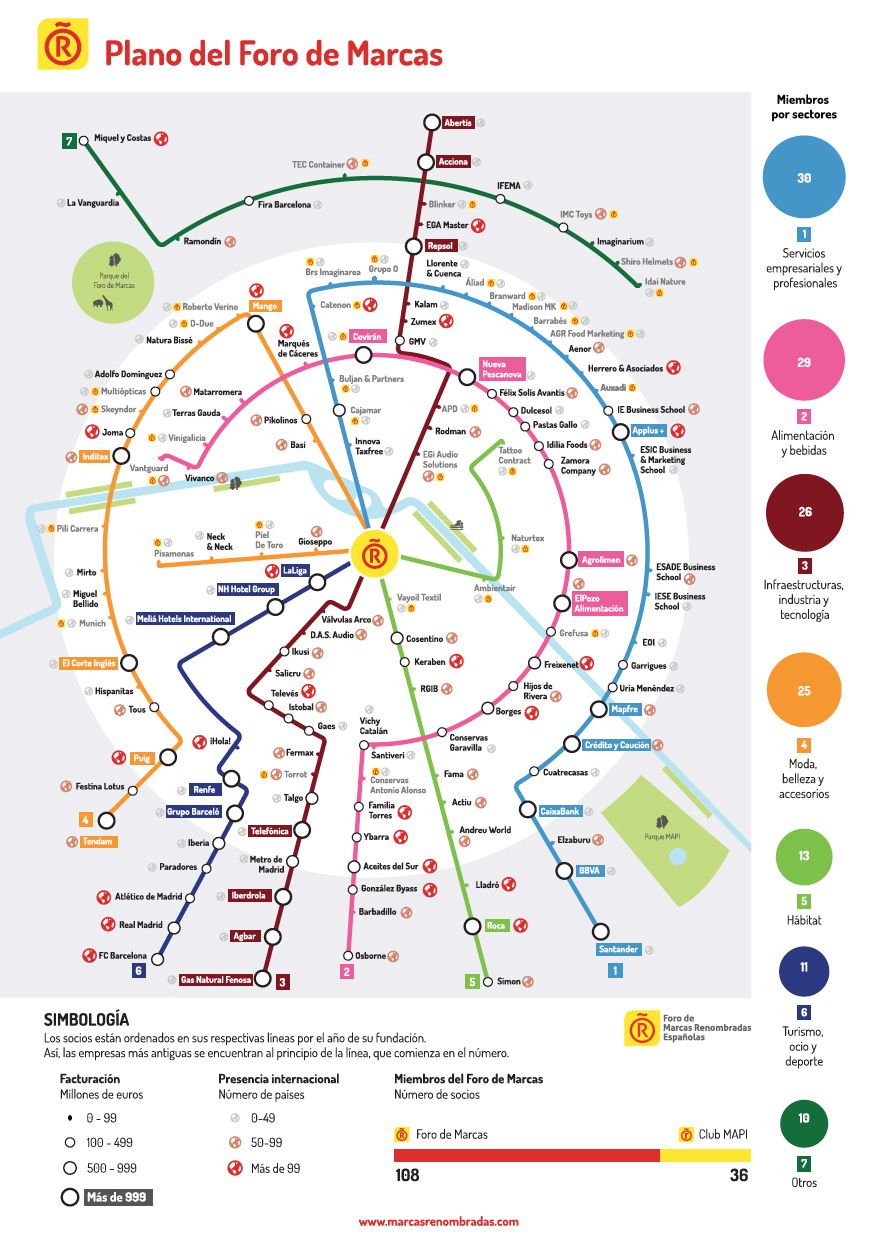
Diagrama conceptual sobre las marcas renombradas de España.
Se incluye como desplegable en la Memoria de Actividades 2017.
Foro de Marcas
Dosis Font
2018


Diagrama conceptual sobre las marcas renombradas de España.
Se incluye como desplegable en la Memoria de Actividades 2017.
Foro de Marcas
Dosis Font
2018


The Travel Gold Rush 2020
Pioneering growth and profitability trends in the travel sector
Developed by Oxford Economics in partnership with Amadeus
La caída del turismo, 2009
-4,2%
However, global tourism arrivals fell by 4.2% in 2009 to 880 million as the effects of recession hit. Tourism receipts ($852 billion) were 5.7% below the levels of 2008 – suggesting that people were also spending less per trip if they did travel.
Los ingresos adicionales
Antes incluidos en el billete, ahora desglosados.
– Maletas
– Equipaciones
– Comidas
– Snacks
– Bebidas
– Medicinas
– Seguridad de élite
– Garantías de asiento
– Posición en el avión
Ingresos adicionales
2006: 1.700 millones de euros
2009: 11.000 millones de euros.
According to IdeaWorks, worldwide airline ancillary revenues were some €11 billion in 2009 – up from only €1.7 billion in 2006. 72% of airlines worldwide derive ancillary revenue from hotel and rental car bookings.
Evolución de los billetes económicos y los de primera.
Un gran ejemplo para ilustrar a quién afecta la crisis económica.
Los cambios en las destinos, 2020
About Amadeus
The leading provider of IT solutions to your tourism and travel industry
Amadeus is a leading transaction processor for the global travel and tourism industry, providing transaction processing power and technology solutions to both travel providers (including full service carriers and low-cost airlines, hotels, rail operators, cruise and ferry operators, car rental companies and tour operators) and travel agencies (both online and offline). The company acts both as a worldwide network connecting travel providers and travel agencies through a highly effective processing platform for the distribution of travel products and services (through our Distribution business), and as a provider of a comprehensive portfolio of IT solutions which automate certain mission-critical business processes, such as reservations, inventory management and operations for travel providers (through our IT solutions business).
About Oxford Economics
Economics matters. Combining skilled analysis with detailed economic and industry information provides a sound foundation for your business decisions and thought leadership activities.
Oxford Economics is one of the world’s foremost global forecasting and research consultancies. Founded in 1981 as a joint venture with Templeton College, the business college of Oxford University, Oxford Economics has since grown into a major independent provider of global economic, industry and business analysis.
A leader in quantitative analysis, Oxford Economics relies on detailed economic research and cutting-edge analytical tools to help our clients assess the opportunities, challenges and strategic choices they face now and in the future.
By using a suite of time-tested models, our team of more than 60 professional economists and industry experts provide you with the analysis you need for making decisions and developing thought leadership. We help you identify future global economic and business trends and what they will mean for your organisation, industry, market or customers. And we present our insights and foresights in clear business language, backed by a brand you can trust.
Europe 2020
A European Strategy for Smart , sustainable and inclusive growth.
European Commision
Marzo de 2010
Los tres escenarios estudiados para Europa 2020.
‘Europe is left with clear yet challenging choices. Either we face up collectively to the immediate challenge of the recovery and to long-term challenges – globalisation, pressure on resources, ageing, – so as to make up for the recent losses, regain competitiveness, boost productivity and put the EU on an upward path of prosperity («sustainable recovery»).
Or we continue at a slow and largely uncoordinated pace of reforms, and we risk ending up with a permanent loss in wealth, a sluggish growth rate («sluggish recovery») possibly leading to high levels of unemployment and social distress, and a relative decline on the world scene («lost decade»)’.
Un mal gráfico. 33 malos gráficos.
Un puzle infográfico.
De un vistazo, ¿cuál es la tendencia de España?
Gráfico contenido en el informe ‘Euro Health Consumer Index 2009′ dado a conocer ayer.
El intercambio de golpes visuales entre el rojo y el amarillo no ayudan a leer las barras. Para una bandera está bien, pero no para un gráfico.
De un vistazo, ¿qué sistema sanitario se encuentra en el puesto 22?