La NASA ha dado a conocer hoy en su página digital las placas de las sondas Voyager.

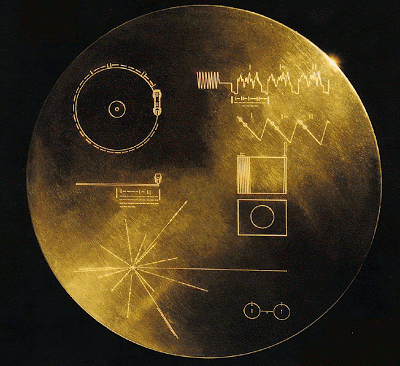
Imagen del pequeño metal que portaban las cápsulas Voyager 1 y 2 y que contiene un mensaje que, en principio, deberían entender los extraterrestres si las encontrasen perdidas por el espacio.
El mensaje se encuentra en un disco reproducible de oro con sonidos e imágenes de nuestra cultura (animales, música, lenguas, un mensaje de Carter y de otro de la ONU).
Sobre la placa, están incrustadas las instrucciones para hacerlo sonar (ver imagen superior).
Pioneer 10 y 11, precedentes de las misiones Voyager, también portaban una placa de metal con información sobre los humanos.
—————————————————————
Pioneers 10 and 11, which preceded Voyager, both carried small metal plaques identifying their time and place of origin for the benefit of any other spacefarers that might find them in the distant future. With this example before them, NASA placed a more ambitious message aboard Voyager 1 and 2-a kind of time capsule, intended to communicate a story of our world to extraterrestrials. The Voyager message is carried by a phonograph record-a 12-inch gold-plated copper disk containing sounds and images selected to portray the diversity of life and culture on Earth. The contents of the record were selected for NASA by a committee chaired by Carl Sagan of Cornell University, et. al. Dr. Sagan and his associates assembled 115 images and a variety of natural sounds, such as those made by surf, wind and thunder, birds, whales, and other animals. To this they added musical selections from different cultures and eras, and spoken greetings from Earth-people in fifty-five languages, and printed messages from President Carter and U.N. Secretary General Waldheim. Each record is encased in a protective aluminum jacket, together with a cartridge and a needle. Instructions, in symbolic language, explain the origin of the spacecraft and indicate how the record is to be played. The 115 images are encoded in analog form. The remainder of the record is in audio, designed to be played at 16-2/3 revolutions per minute. It contains the spoken greetings, beginning with Akkadian, which was spoken in Sumer about six thousand years ago, and ending with Wu, a modern Chinese dialect. Following the section on the sounds of Earth, there is an eclectic 90-minute selection of music, including both Eastern and Western classics and a variety of ethnic music. Once the Voyager spacecraft leave the solar system (by 1990, both will be beyond the orbit of Pluto), they will find themselves in empty space. It will be forty thousand years before they make a close approach to any other planetary system. As Carl Sagan has noted, «The spacecraft will be encountered and the record played only if there are advanced spacefaring civilizations in interstellar space. But the launching of this bottle into the cosmic ocean says something very hopeful about life on this planet.»

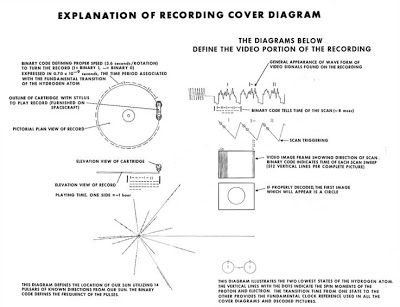
Diagrama explicativo.
—————————————————————
«In the upper left-hand corner is an easily recognized drawing of the phonograph record and the stylus carried with it. The stylus is in the correct position to play the record from the beginning. Written around it in binary arithmetic is the correct time of one rotation of the record, 3.6 seconds, expressed in time units of 0,70 billionths of a second, the time period associated with a fundamental transition of the hydrogen atom. The drawing indicates that the record should be played from the outside in. Below this drawing is a side view of the record and stylus, with a binary number giving the time to play one side of the record – about an hour.
«The information in the upper right-hand portion of the cover is designed to show how pictures are to be constructed from the recorded signals. The top drawing shows the typical signal that occurs at the start of a picture. The picture is made from this signal, which traces the picture as a series of vertical lines, similar to
ordinary television (in which the picture is a series of horizontal lines). Picture lines 1, 2 and 3 are noted in binary numbers, and the duration of one of the «picture lines,» about 8 milliseconds, is noted. The drawing immediately below shows how these lines are to be drawn vertically, with staggered «interlace» to give the correct picture rendition. Immediately below this is a drawing of an entire picture raster, showing that there are 512 vertical lines in a complete picture. Immediately below this is a replica of the first picture on the record to permit the recipients to verify that they are decoding the signals correctly. A circle was used in this picture to insure that the recipients use the correct ratio of horizontal to vertical height in picture reconstruction.
«The drawing in the lower left-hand corner of the cover is the pulsar map previously sent as part of the plaques on Pioneers 10 and 11. It shows the location of the solar system with respect to 14 pulsars, whose precise periods are given. The drawing containing two circles in the lower right-hand corner is a drawing of the hydrogen atom in its two lowest states, with a connecting line and digit 1 to indicate that the time interval associated with the transition from one state to the other is to be used as the fundamental time scale, both for
the time given on the cover and in the decoded pictures.
«Electroplated onto the record’s cover is an ultra-pure source of uranium-238 with a radioactivity of about 0.00026 microcuries. The steady decay of the uranium source into its daughter isotopes makes it a kind of radioactive clock. Half of the uranium-238 will decay in 4.51 billion years. Thus, by examining this two-centimeter diameter area on the record plate and measuring the amount of daughter elements to the remaining uranium-238, an extraterrestrial recipient of the Voyager spacecraft could calculate the time elapsed since a spot of uranium was placed aboard the spacecraft. This should be a check on the epoch of launch, which is also described by the pulsar map on the record cover.»


