MAPS: GlobCover, ESA

El nuevo mapa de la Agencia Espacial Europea.

Gracias por visitar el sitio de Juantxo Cruz

21 December 2010
ESA’s 2009 global land cover map has been released and is now available to the public online from the ‘GlobCover’ website. GlobCover 2009 proves the sharpest possible global land cover map can be created within a year.

The map was produced using 12 months of data from Envisat’s Medium Resolution Imaging Spectrometer at a resolution of 300 m.
ESA and Belgium’s Université catholique de Louvain created the map using software developed by Medias France and Germany’s Brockmann Consult on data collected from 1 January to 31 December 2009. GlobCover 2009 was generated within a year of acquiring the final satellite data.

The map’s legend uses the UN Food and Agriculture Organisation’s Land Cover Classification System.

Some 8000 people have downloaded the previous version, GlobCover 2005. These maps are useful for studying the effects of climate change, conserving biodiversity and managing natural resources.

Credits: ESA 2010 and Université Catholique de Louvain

MAPS: Agua en peligro, Nature

Gracias por visitar el sitio de Juantxo Cruz

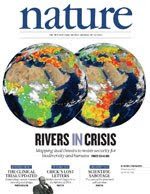
Portada de Nature

The security of water supply for humans and the biodiversity of rivers are often seen as competing goals, but need that be the case? A new global-scale analysis of freshwater resources advances the field by considering threats to both river biodiversity (on the left on the cover) and to human water security, after accounting for investments in infrastructure and water services (right). The maps reveal that the world’s rivers are in a state of crisis. Achieving a sustainable solution to these problems, the authors say, will require strategies that jointly address water security for humans and biodiversity. COVER CREDIT: Stanley Glidden

Gracias por visitar el sitio de Juantxo Cruz

Amenazas a la biodiversidad.
El 80% de la población de la Tierra está expuesta al impacto de la falta de seguridad sobre el agua.

The maps demonstrate pandemic impacts on both human water security and biodiversity and are highly coherent, although not identical (biodiversity threat = 0.964 × human water security threat + 0.018; r = 0.97, P 

STATS: La huella ecológica

Gracias por visitar el sitio de Juantxo Cruz

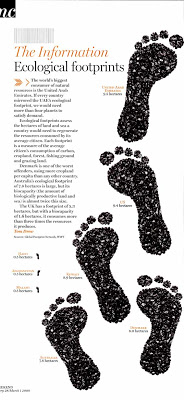
La huella ecológica es la presión humana sobre el planeta expresada en hectáreas per cápita. Es la medida de lo que la humanidad demanda al planeta. Cuanto más hectáreas, más se está explotando la naturaleza.

La biocapacidad es la habilidad de un ecosistema para producir materiales biológicos y absorber las basuras generadas por los humanos. También se expresa en hectáreas per cápita.

Huella ecológica y biocapacidad están relacionadas. Puede ser que un país tenga una alta huella ecológica, pero si tiene también alta sus biocapacidad, la degradación de su ecosistema es menor.

Este es un gráfico sencillo del suplemento del Financial Times ‘FT Weekend’ publicado este fin de semana que compara la huella ecológica de varios países. Se hecha en falta haber puesto el dato en relación con la biocapacidad.

Fuente: Global Footprint Network, WWF.

!Gracias por visitar mi sitio! | Copyright © 1992- 2025 juantxo_cruz. Todos los derechos reservados.