Antonio Petruccelli, maestro de los años 30 y 40 del siglo XX

Si no conoces el trabajo de Antonio Petruccelli (Fort Lee, NJ, EEUU, 1907-1994), merece la pena que le prestes unos minutos de atención.
Ilustrador, diseñador, cartógrafo y diagramador muy inspirador, uno de los grandes del siglo XX.

Si pones en Google su nombre aparecen bastantes de sus fantásticas portadas para Fortune Magazine (desde 1935 hasta 1945) y The New Yorker.
Aquí os dejo algunas de sus gráficas.

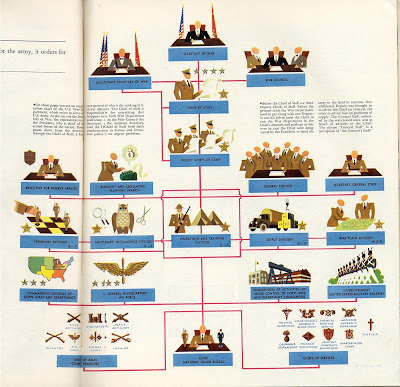
US War Department, enero 1941

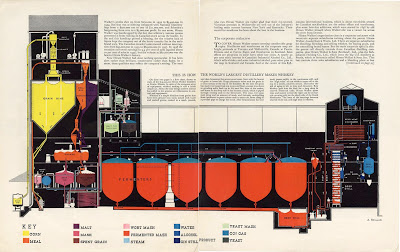
Antonio Petruccelli, The World´s Largest Distillery
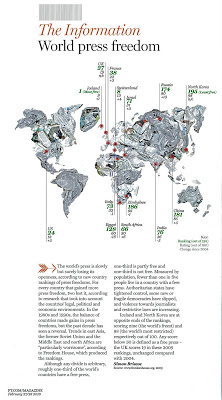
Fortune

Antonio Petruccelli, Fortune Magazine, 1942

The main dynamics of the US Technological mobilization for war.

One big family, A Management Chart, Febrero, 1940

Italia, 1934

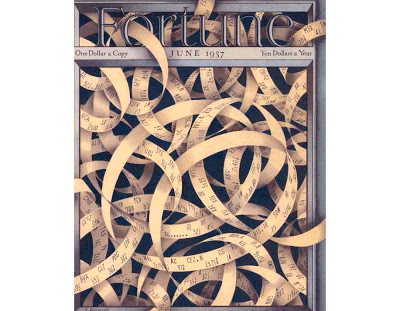
Portada de Fortune, junio 1937

Estos son algunos links que recogen su trabajo:

· Master Illustrator, Antonio Petruccelli

· Antonio Petruccelli en Fulltable, cronología de sus trabajos (muy recomendable)

· Vintage Fortune en Facebook

· Society of Illustrator

GRAPHIC GEMS: Atlas zu Alex. v. Humboldt’s Kosmos in zweiundvierzig, 1851

Gracias por visitar el sitio de Juantxo Cruz

Atlas zu Alex. v. Humboldt’s Kosmos in zweiundvierzig
Infographic on the composition of the earth’s crust
Stuttgart, Alemania
Verlag von Krais & Hoffmann
1851
42 infografías para la historia.
No sólo un atlas. No sólo mapas.
Incluyen increíbles ilustraciones para explicar los fenómenos naturales.

Gracias por visitar el sitio de Juantxo Cruz

Ver Botanicus

MAS:
Galería en Flickr

Bibliodyssey

The rise of thematic or special purpose cartography, which focuses on mapping the distribution of single or multiple interrelated phenomena, had its origins in the advances in the natural sciences in the late eighteenth and early nineteenth centuries, particularly with the collection of vast amounts of scientific data and the search for innovative techniques of presenting this data graphically. Examples of early physical geography atlases in the Library of Congress include Alexander von Humboldt’s Atlas gographique et physique du royaume de la Nouvelle-Espagne (Paris, 1811), which records his observations during a 1799 to 1804 expedition to South and Central America; Heinrich Berghaus’s three-volume Physikalischer Atlas (Gotha, 1845 1848), the first atlas to portray the physical geography of the world; Alexander Keith Johnston’s Physical Atlas (Edinburgh, 1848), an English adaptation of the Berghaus atlas; and Traugott Broome’s Atlas zu Alex. v. Humboldt’s Kosmos [Stuttgart, 1851 1853], which was prepared to accompany Humboldt’s five-volume Kosmos, a complete physical geography of the universe.

MAPS: GlobCover, ESA

El nuevo mapa de la Agencia Espacial Europea.

Gracias por visitar el sitio de Juantxo Cruz

21 December 2010
ESA’s 2009 global land cover map has been released and is now available to the public online from the ‘GlobCover’ website. GlobCover 2009 proves the sharpest possible global land cover map can be created within a year.

The map was produced using 12 months of data from Envisat’s Medium Resolution Imaging Spectrometer at a resolution of 300 m.
ESA and Belgium’s Université catholique de Louvain created the map using software developed by Medias France and Germany’s Brockmann Consult on data collected from 1 January to 31 December 2009. GlobCover 2009 was generated within a year of acquiring the final satellite data.

The map’s legend uses the UN Food and Agriculture Organisation’s Land Cover Classification System.

Some 8000 people have downloaded the previous version, GlobCover 2005. These maps are useful for studying the effects of climate change, conserving biodiversity and managing natural resources.

Credits: ESA 2010 and Université Catholique de Louvain

MAPS: Facebook y Mark Zuckerberg

Gracias por visitar el sitio de Juantxo Cruz

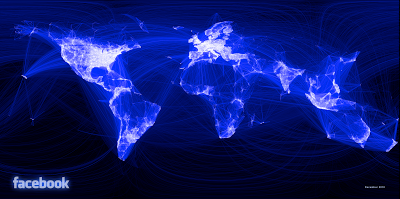
Visualización de las relaciones de amistad en Facebook.

Por Paul Butler, ingeniero de la red social.

‘Visualizing data is like photography. Instead of starting with a blank canvas, you manipulate the lens used to present the data from a certain angle.

When the data is the social graph of 500 million people, there are a lot of lenses through which you can view it. One that piqued my curiosity was the locality of friendship. I was interested in seeing how geography and political borders affected where people lived relative to their friends. I wanted a visualization that would show which cities had a lot of friendships between them.

I began by taking a sample of about ten million pairs of friends from Apache Hive, our data warehouse. I combined that data with each user’s current city and summed the number of friends between each pair of cities. Then I merged the data with the longitude and latitude of each city.

At that point, I began exploring it in R, an open-source statistics environment. As a sanity check, I plotted points at some of the latitude and longitude coordinates. To my relief, what I saw was roughly an outline of the world. Next I erased the dots and plotted lines between the points. After a few minutes of rendering, a big white blob appeared in the center of the map. Some of the outer edges of the blob vaguely resembled the continents, but it was clear that I had too much data to get interesting results just by drawing lines. I thought that making the lines semi-transparent would do the trick, but I quickly realized that my graphing environment couldn’t handle enough shades of color for it to work the way I wanted.

Instead I found a way to simulate the effect I wanted. I defined weights for each pair of cities as a function of the Euclidean distance between them and the number of friends between them. Then I plotted lines between the pairs by weight, so that pairs of cities with the most friendships between them were drawn on top of the others. I used a color ramp from black to blue to white, with each line’s color depending on its weight. I also transformed some of the lines to wrap around the image, rather than spanning more than halfway around the world.

After a few minutes of rendering, the new plot appeared, and I was a bit taken aback by what I saw. The blob had turned into a surprisingly detailed map of the world. Not only were continents visible, certain international borders were apparent as well. What really struck me, though, was knowing that the lines didn’t represent coasts or rivers or political borders, but real human relationships. Each line might represent a friendship made while travelling, a family member abroad, or an old college friend pulled away by the various forces of life.

Later I replaced the lines with great circle arcs, which are the shortest routes between two points on the Earth. Because the Earth is a sphere, these are often not straight lines on the projection.

When I shared the image with others within Facebook, it resonated with many people. It’s not just a pretty picture, it’s a reaffirmation of the impact we have in connecting people, even across oceans and borders’.

Paul is an intern on Facebook’s data infrastructure engineering team.

Gracias por visitar el sitio de Juantxo Cruz


Personaje del año, Time

Mark Zuckerberg
For connecting more than half a billion people and mapping the social relations among them; for creating a new system of exchanging information; and for changing how we all live our lives, Mark Elliot Zuckerberg is TIME’s 2010 Person of the Year

GRAPHICS: El pulso de la nación, Twitter, CCIS

Gracias por visitar el sitio de Juantxo Cruz

© 2010 Alan Mislove, Sune Lehmann, Yong-Yeol Ahn, Jukka-Pekka Onnela, J. Niels Rosenquist. Some rights reserved. Images, poster, and movie are shared under the Creative Commons Attribution 3.0 License.

Visualización: El pulso de la nación estadounidense.
Alan Mislove
Harvard University
Northeastern University of Boston. College of Computer and Information Science.
Cartograma: mapa en el que se refleja una variable. En este caso, el número de ‘tweets’.
Software de Mark E. J. Newman.
Se analizaron 300 millones de comentarios en Twitter y se trasladaron al mapa por franjas horarias.
De 12.00h a 16.00h, no están para bromas.

Equipo:
Alan Mislove, College of Computer and Information Science, Northeastern University
Sune Lehmann, Center for Complex Network Research, Northeastern University
Yong-Yeol Ahn, Center for Complex Network Research, Northeastern University
Jukka-Pekka Onnela, Harvard Medical School, Harvard University
J. Niels Rosenquist, Harvard Medical School, Harvard University

Gracias por visitar el sitio de Juantxo Cruz

Libro: Atlas of The Real World.
Hardcover: 416 pages
Publisher: Thames & Hudson (October 27, 2008)
Language: English
ISBN-10: 0500514259
ISBN-13: 978-0500514252

GRAPHICS: Heathrow, interactivo

Gracias por visitar el sitio de Juantxo Cruz

El Reino Unido sigue adelante con un proyecto de 13.200 millones de dólares para construir una nueva terminal en el aeropuerto de Heathrow (1946), que ha sido muy criticado por grupos ecológicos y vecinos (como el de la foto). Incluso el alcalde de Londres, Boris Jonson, se opone a la ampliación promovida por el gobierno laborista.

La pista se inauguró en 1946, la primera Terminal se construyó en 1955 (la actual Terminal 2), la Terminal 1 es de 1969, la tercera de 1961, la cuarta de 1986 y la quinta de marzo de 2008.

En 2008, 67 millones de pasajeros y 478.000 aviones desfilaron por el aeropuerto.

En su página digital, se pueden consultar todos los planos
de la terminales en PDF y ofrece un gráfico interactivo interesante.

!Gracias por visitar mi sitio! | Copyright © 1992- 2025 juantxo_cruz. Todos los derechos reservados.