GRAPHICS: Emisiones de CO2, CDIAC

Carbon Dioxide Information Analysis Center

The Carbon Dioxide Information Analysis Center (Thomas A. Boden, Director), which includes the World Data Center for Atmospheric Trace Gases, has served as the primary climate-change data and information analysis center of the U.S. Department of Energy (DOE) since 1982.

Gracias por visitar el sitio de Juantxo Cruz

EEUU
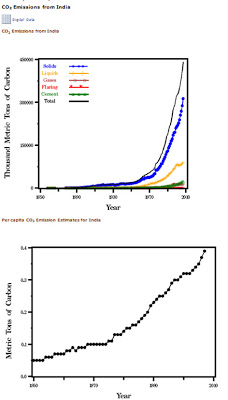
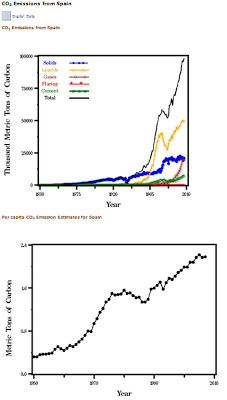
Total y per cápita, toneladas métricas de carbón

Gracias por visitar el sitio de Juantxo Cruz

China

Gracias por visitar el sitio de Juantxo Cruz

India

Gracias por visitar el sitio de Juantxo Cruz

España

Gracias por visitar el sitio de Juantxo Cruz

Magnifica visualización actualizada en la portada de hoy del Washington Post.

Gracias por visitar el sitio de Juantxo Cruz

En internet.

MAPS: Sequía, 2000-2099, UCAR

Drought under global warning: a review
Aiguo Dai
Publication: Wiley Interdisciplinary Reviews: Climate Change
National Center for Atmospheric Research (NCAR)

The detailed analysis concludes that warming temperatures associated with climate change will likely create increasingly dry conditions across much of the globe in the next 30 years, possibly reaching a scale in some regions by the end of the century that has rarely, if ever, been observed in modern times.

Gracias por visitar el sitio de Juantxo Cruz

Future drought. These four maps illustrate the potential for future drought worldwide over the decades indicated, based on current projections of future greenhouse gas emissions. These maps are not intended as forecasts, since the actual course of projected greenhouse gas emissions as well as natural climate variations could alter the drought patterns.

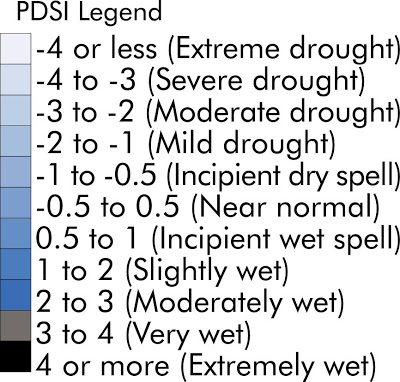
The maps use a common measure, the Palmer Drought Severity Index, which assigns positive numbers when conditions are unusually wet for a particular region, and negative numbers when conditions are unusually dry. A reading of -4 or below is considered extreme drought. Regions that are blue or green will likely be at lower risk of drought, while those in the red and purple spectrum could face more unusually extreme drought conditions. (Courtesy Wiley Interdisciplinary Reviews, redrawn by UCAR. This image is freely available for media use. Please credit the University Corporation for Atmospheric Research.

The University Corporation for Atmospheric Research promotes partnership in a collaborative community dedicated to understanding the atmosphere—the air around us—and the complex processes that make up the Earth system, from the ocean floor to the Sun’s core. more below >

The National Center for Atmospheric Research provides research, observing and computing facilities, and a variety of services for the atmospheric and Earth sciences community. more below >

UCAR Community Programs provide leadership, services, and innovation in support of the community’s education and research goals. more below >

NCAR and the UCAR Community Programs are managed by UCAR, a nonprofit consortium of research universities, on behalf of the National Science Foundation and the university community.

Gracias por visitar el sitio de Juantxo Cruz

THE PALMER DROUGHT SEVERITY INDEX

The Palmer Index was developed by Wayne Palmer in the 1960s and uses temperature and rainfall information in a formula to determine dryness. It has become the semi-official drought index.

The Palmer Index is most effective in determining long term drought—a matter of several months—and is not as good with short-term forecasts (a matter of weeks). It uses a 0 as normal, and drought is shown in terms of minus numbers; for example, minus 2 is moderate drought, minus 3 is severe drought, and minus 4 is extreme drought. At present, northern Virginia is at a minus 4.0 point; north central Maryland is at a minus 4.2 level, and southern Maryland is at least a minus 4 level.

The Palmer Index can also reflect excess rain using a corresponding level reflected by plus figures; i.e., 0 is normal, plus 2 is moderate rainfall, etc. At present, north central Iowa is at a plus 5.2 level, and parts of South Dakota are even higher.

The advantage of the Palmer Index is that it is standardized to local climate, so it can be applied to any part of the country to demonstrate relative drought or rainfall conditions. The negative is that it is not as good for short term forecasts, and is not particularly useful in calculating supplies of water locked up in snow, so it works best east of the Continental Divide.

The Crop Moisture Index (CMI) is also a formula that was also developed by Wayne Palmer subsequent to his development of the Palmer Drought Index.

The CMI responds more rapidly than the Palmer Index and can change considerably from week to week, so it is more effective in calculating short-term abnormal dryness or wetness affecting agriculture.

CMI is designed to indicate normal conditions at the beginning and end of the growing season; it uses the same levels as the Palmer Drought Index.

It differs from the Palmer Index in that the formula places less weight on the data from previous weeks and more weight on the recent week.
Gracias por visitar el sitio de Juantxo Cruz

The Palmer Drought Indices

The Palmer Z Index measures short-term drought on a monthly scale. The Palmer Crop Moisture Index (CMI) measures short-term drought on a weekly scale and is used to quantify drought’s impacts on agriculture during the growing season.

The Palmer Drought Severity Index (PDSI) (known operationally as the Palmer Drought Index (PDI)) attempts to measure the duration and intensity of the long-term drought-inducing circulation patterns. Long-term drought is cumulative, so the intensity of drought during the current month is dependent on the current weather patterns plus the cumulative patterns of previous months. Since weather patterns can change almost literally overnight from a long-term drought pattern to a long-term wet pattern, the PDSI (PDI) can respond fairly rapidly.

The hydrological impacts of drought (e.g., reservoir levels, groundwater levels, etc.) take longer to develop and it takes longer to recover from them. The Palmer Hydrological Drought Index (PHDI), another long-term drought index, was developed to quantify these hydrological effects. The PHDI responds more slowly to changing conditions than the PDSI (PDI).

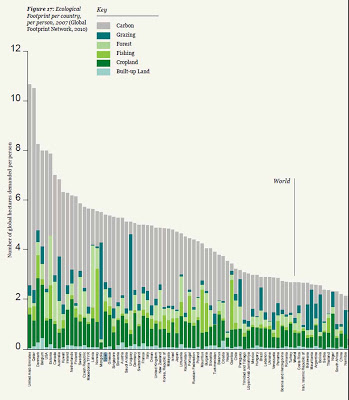
GRAPHICS: Huella ecológica, WWF

Gracias por visitar el sitio de Juantxo Cruz

Living Planet Report

Publication details
Published in October 2010 by WWF – World Wide
Fund For Nature (Formerly World Wildlife Fund),
Gland, Switzerland. Any reproduction in full or in
part of this publication must mention the title and
credit the above-mentioned publisher as the
copyright owner.

© Text and graphics: 2010 WWF
All rights reserved
The material and the geographical designations in
this report do not imply the expression of any opinion
whatsoever on the part of WWF concerning the legal
status of any country, territory, or area, or concerning
the delimitation of its frontiers or boundaries.

Gracias por visitar el sitio de Juantxo Cruz

La huella ecológica.
1961-2007
La biocapacidad total sería un planeta Tierra.

Gracias por visitar el sitio de Juantxo Cruz

La productividad del planeta se come todos los recursos para regenerarla (1,5 tierras).
Enemigo número 1: el carbón.

PRESS: Barro rojo y tóxico, Hungría

En Hungría, manchetas en azul.
Portadas de esta semana.
Elecciones municipales el pasado domingo.
El martes llegó la catástrofe.
Inundación, estado de emergencia, desastre natural, ecológico y humano.
Rumbo al Danubio.
Primer ministro: Viktor Orban

Gracias por visitar el sitio de Juantxo Cruz

Békés Hírlap
6 oct.

Gracias por visitar el sitio de Juantxo Cruz

Zalai Hírlap
4 oct.

Gracias por visitar el sitio de Juantxo Cruz

Zalai Hírlap
5 oct.

Gracias por visitar el sitio de Juantxo Cruz

Zalai Hírlap
6 oct.

Gracias por visitar el sitio de Juantxo Cruz

Zalai Hírlap
7 oct.

Gracias por visitar el sitio de Juantxo Cruz

Kelet
4 oct.

Gracias por visitar el sitio de Juantxo Cruz

Kelet
5 oct.

Gracias por visitar el sitio de Juantxo Cruz

Kelet
6 oct.

Gracias por visitar el sitio de Juantxo Cruz

Kelet
7 cot.

Gracias por visitar el sitio de Juantxo Cruz

Vas Népe
7 oct.

MAPS: Agua en peligro, Nature

Gracias por visitar el sitio de Juantxo Cruz

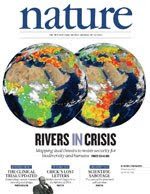
Portada de Nature

The security of water supply for humans and the biodiversity of rivers are often seen as competing goals, but need that be the case? A new global-scale analysis of freshwater resources advances the field by considering threats to both river biodiversity (on the left on the cover) and to human water security, after accounting for investments in infrastructure and water services (right). The maps reveal that the world’s rivers are in a state of crisis. Achieving a sustainable solution to these problems, the authors say, will require strategies that jointly address water security for humans and biodiversity. COVER CREDIT: Stanley Glidden

Gracias por visitar el sitio de Juantxo Cruz

Amenazas a la biodiversidad.
El 80% de la población de la Tierra está expuesta al impacto de la falta de seguridad sobre el agua.

The maps demonstrate pandemic impacts on both human water security and biodiversity and are highly coherent, although not identical (biodiversity threat = 0.964 × human water security threat + 0.018; r = 0.97, P 

STATS: BP, -32.192 millones de dólares

Gracias por visitar el sitio de Juantxo Cruz

Resultados de BP. Segundo cuarto de 2010.
Pérdidas 2010; 16.973 millones de dólares
Ganancias 2009: 3.140 millones.
COSTE DEL VERTIDO: 32.192 millones de dólares.
10.000 millones serán aplicados en tasas, lo pagarán los contribuyentes.

Con este dinero (32.192 millones de dólares) te puedes comprar:

Gracias por visitar el sitio de Juantxo Cruz

85.000 Roll Royce Phantom (380.000 $)

Gracias por visitar el sitio de Juantxo Cruz

121 Boeing 747-400 (266 millones $)

Gracias por visitar el sitio de Juantxo Cruz

245 Cristianos Ronaldo (131 millones $)

Gracias por visitar el sitio de Juantxo Cruz

115 millones de suscripciones a The New York Times durante un año de lunes a domingo. (70 dólares trimestrales, 280 anuales)

VIDEO: 25.000 barriles de petróleo x 4=BP

Son muchos barriles.
1 barril=150 kilos=159 litros

BP estima que el vertido en el Golfo de México podría llegar a 100.000 barriles de petróleo al día.
Son 15,9 millones de litros al día.
Son 15.000 toneladas al día.
REUTERS.

Hasta ahora, el gobierno EEUU admitía 60.000 barriles al día.
Worst Case Scenario.

Prestige:
77.000 toneladas.
513.333 barriles.

BP estaría vertiendo 1 Prestige cada cinco días.

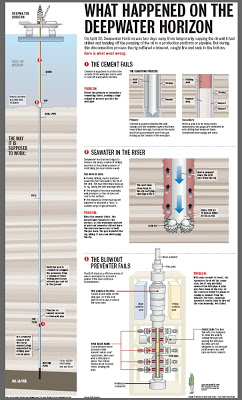
GRAPHICS: The Times-Picayune

El diario local de Nueva Orleans, un icono.
Grandísimo trabajo INFOGRÁFICO.
The Times Picayune.
Desde 1837.
Índice de infografías.
Científicos y claros.
No abandonaron la ciudad durante las inundaciones provocadas por el Katrina, 2005, pese a que la ciudad había sido evacuada.
Gran cobertura del vertido, 2010.

Gracias por visitar el sitio de Juantxo Cruz

Tamaño del vertido.

Gracias por visitar el sitio de Juantxo Cruz

Cómo es la tubería averiada.

Gracias por visitar el sitio de Juantxo Cruz

¿Qué paso?

Gracias por visitar el sitio de Juantxo Cruz

Intento fallido.

Gracias por visitar el sitio de Juantxo Cruz

La válvula.

!Gracias por visitar mi sitio! | Copyright © 1992- 2025 juantxo_cruz. Todos los derechos reservados.