Gran gráfico de The Chronicle of Higher Education.
Análisis de los principales actores en la educación online.
Washington DC.
EEUU.
Periodismo y Datos
Presentación introductoria al Periodismo de Datos y la Visualización.
STATS: Abandono escolar, Comisión Europea
COMMUNICATION FROM THE COMMISSION TO THE EUROPEAN
PARLIAMENT, THE COUNCIL, THE EUROPEAN ECONOMIC AND SOCIAL
COMMITTEE AND THE COMMITTEE OF THE REGIONS
Tackling early school leaving: A key contribution to the Europe 2020 Agenda
En España, un 31,2% de la población de entre 18 y 24 años tienen un nivel máximo de estudios de 4º de ESO. Abandonan.
El objetivo para 2020 es alcanzar el 10% en toda la UE.
Good luck!
GRAPHICS: Informe PISA 2009
Informe PISA
Cada tres años.
Programme for International Student Assessment (PISA) 2009 Results:
What Students Know and Can Do Student Performance in Reading,Mathematics and Science.
OCDE
Las clasificaciones en lectura, matemáticas y ciencias.
Methods
• Around 470 000 students completed the assessment in 2009, representing about 26 million 15-year-olds in
the schools of the 65 participating countries and economies. Some 50 000 students took part in a second
round of this assessment in 2010, representing about 2 million 15 year-olds from 9 additional partner
countries and economies.
• Each participating student spent two hours carrying out pencil-and-paper tasks in reading, mathematics and
science. In 20 countries, students were given additional questions via computer to assess their capacity to
read digital texts.
• The assessment included tasks requiring students to construct their own answers as well as multiple-choice
questions. The latter were typically organised in units based on a written passage or graphic, much like the
kind of texts or figures that students might encounter in real life.
• Students also answered a questionnaire that took about 30 minutes to complete. This questionnaire focused
on their personal background, their learning habits, their attitudes towards reading, and their engagement
and motivation.
• School principals completed a questionnaire about their school that included demographic characteristics
and an assessment of the quality of the learning environment at school.
Corrigenda to OECD publications may be found on line at: www.oecd.org/publishing/corrigenda.
PISATM, OECD/PISATM and the PISA logo are trademaks of the Organisation for Economic Co-operation and Development (OECD).
All use of OECD trademarks is prohibited without written permission from the OECD.
© OECD 2010
Angel Gurría
OECD Secretary-General
GRAPHICS: Economía de la Educación y el VANP
Securing a sustainable future for higher education
AN INDEPENDENT REVIEW OF HIGHER EDUCATION funding & STUDENT FINANCE.
12 October 2010
www.independent.gov.uk/browne-report
Estudio independiente sobre la financiación de la Universidad.
Reino Unido.
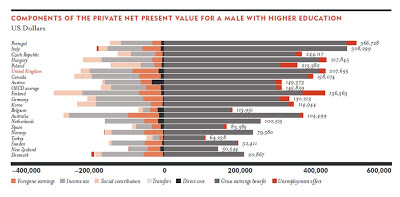
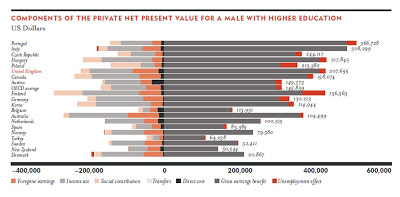
Componentes del valor neto privado para un hombre con educación superior.
Net present value (NPV): La rentabilidad de una inversión.
Se sitúa a valor presente los flujos de caja futuros que va a generar el estudiante.
La inversión que se realiza en relación a los beneficios que se obtendrán.
Cuanto más alto es el NPV, mejor habrá sido la inversión.
El Valor Actual Neto Privado (VANP) representa la equivalencia presente de los ingresos netos futuros y presentes de un proyecto expresados a precios de mercado.
La educación es un proyecto e inversión a largo plazo.
Economía de la educación.
Así, cuanto más elevado es el subsidio público en la educación, más bajo es el gasto privado de la inversión en educación y más alto es el valor actual neto para el indiviudo particular. Ejemplo.
El Reino Unido plantea subir los costes porque estima que el retorno para el estudiante es elevado y, por tanto, se lo pueden permitir.
Otro efecto colateral de la crisis.
England has an internationally respected system of higher
education that produces major benefits for individuals and
the country. Sustaining future economic growth and social
mobility in an increasingly competitive global knowledge
economy will require increased investment in higher
education. Other countries are already broadening and
strengthening their higher education systems and we need
to rise to this challenge.
Población con educación terciaria (superior).
El gran salto español.
The chart below compares OECD countries in 2008 on
the population aged 25 to 34 with tertiary education and
the population aged 55 to 64 with tertiary education. It
shows that many countries – such as Korea, Japan, Ireland,
Belgium, France and Spain – that have historically lower
levels of participation than the UK have now moved ahead
of us and their participation rates among young people are
higher than ours. The OECD average shows a sharper
increase than the UK as well.
The Independent Review of Higher Education Funding and Student Finance was launched on the 9th November 2009. The review is tasked with making recommendations to Government on the future of fees policy and financial support for full and part-time undergraduate and postgraduate students.
STATS: Accesibilidad a las carreras universitarias
Las carreras universitarias más accesibles y las inaccesibles.
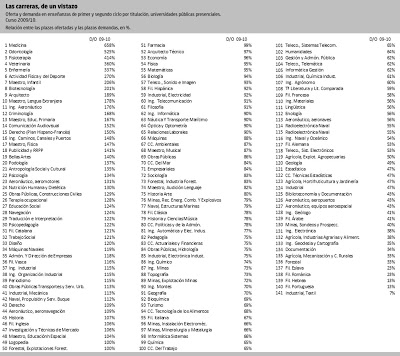
En Medicina, el curso pasado 22.327 estudiantes demandaron estudios.
Las plazas oficiales eran 3.395.
El ratio Demanda/oferta para Medicina es de un 658%.
Para Ingeniero Técnico Industrial especialidad Textil, en el curso 2009/10 hubo sólo 1 demante para una oferta de 15 plazas. El ratio es del 7%.
Ver tablas inferiores, documentos originales.
Estudio del Ministerio de Educación.
Oferta y demanda en enseñanzas de primer y segundo ciclo por titulación, universidades públicas presenciales.
Curso 2009/10.
Página 23
Oferta y demanda en enseñanzas de primer y segundo ciclo por titulación, universidades públicas presenciales.
Curso 2009/10.
Página 24
STATS: Top Universities 2010
Las 200 mejores universidades del mundo, según QS (Quacquarelli Symonds ).
Desde 2004, anual.
Registered Office: 1 Tranley Mews, Fleet Road London, NW3 2DG UK
Cambridge (RU), Harvard (EEUU) y Yale (EEUU) encabezan la clasificación.
En 2010, la británica ha superado a la norteamericana.
Españolas:
148. Universitat de Barcelona
173. Universitat Autònoma de Barcelona
© Quacquarelli Symonds Ltd 2010. www.topuniversities.com. All rights reserved.
Clasificación 2009 de las universidades españolas.
About:
QS links high achievers from the graduate, MBA and executive communities around the world…
…with leading business schools, postgraduate departments at universities and with employers, through websites, events, e-guides and technical solutions.
QS organises the largest business education event in the world, the QS World MBA Tour, the QS World Executive MBA Tour and the leading postgraduate studies information event, the QS World Grad School Tour, amongst an extensive product range including print and online publications and software solutions.
QS is the leading global career and education network for ambitious professionals looking to further both their personal and professional development. With extensive contacts in the field of higher education, our industry expertise and experience gives us the flexibility to adapt to the needs of our prospective clients.
At QS we believe that education and career decisions are too important to leave to chance, so we want to ensure candidates have access to the best tools and the best independent expert information before making a decision.
Our ambition is to be the world’s leading media, events and software company in the higher education field. QS is the most trusted on-line and off-line meeting place for all candidates, schools and businesses for career and educational related decisions.
We are a medium-sized company with over 100 staff in offices throughout the world: London, Paris, Singapore, Shanghai, Boston, Washington DC, Johannesburg and Alicante. A multi-cultural employee base, there are 26 languages spoken in the marketing department alone. The QS World MBA Tour travels to 70 cities in 39 countries enabling over 50,000 ambitious MBA candidates to meet face-to-face with high calibre business schools. The QS World Grad School Tour visits 47 cities in 31 countries bringing the complete A to Z of postgraduate programs to over 40,000 interested masters and PhD students.
Según los baremos que se estudien, las clasificaciones varían de un estudio a otro.
Este es un gráfico interactivo de Ron Coddington y Alex Richards sobre los índices estudiados por diversas publicaciones para realizar sus clasificaciones.
GRAPHICS: Educación e infografía, Cuaderno Intercultural
Fenomenal artículo sobre Infografía de Rosana Larraz con fines didácticos en Cuaderno Intercultural.
‘Las infografías transmiten hechos, procesos, noticias, acontecimientos o datos de forma amena, sintética y visual, facilitando la compresión de información árida o compleja y estimulando el interés del lector que, de un golpe de vista, puede seleccionar en ellas lo que le interesa, lo que ya conoce y lo que no’.
Enlaces interesantes, herramientas y recursos infográficos.
Los comentarios de los profesores no pueden ser más positivos y estimulantes.
Enhorabuena a Cuaderno Intercultural y a Rosana Larraz por este genial artículo. No es fácil encontrar documentos como este que propongan la infografía como método didáctico fuera del ámbito del diseño y la propia infografía.
STATS: El coste de un niño
Los gastos para sacar adelante a un niño hasta los 21 años de edad en el Reino Unido han llegado a 227.000 euros, cifra que no incluye colegios privados.
Un aumento del 43% en los últimos 7 años.
Fuente:
THE GUARDIAN
GRAPHICS: Notas sobre la innovación en la educación
El pasado 13 de mayo de 2008 se celebró en San Francisco (California) un Seminario sobre Innovación en la Educación, específico para periodistas, organizado por The Commonwealth Club of California.
Estas son las notas gráficas tomadas por el moderador del debate David Sibbet: La 5 ideas para el futuro de la educación.


