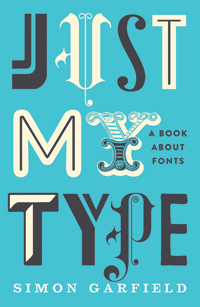
BOOKS: Just My Type, A Book about Fonts

Gracias por visitar el sitio de Juantxo Cruz

Product Description
What’s your type? Suddenly everyone’s obsessed with fonts. Whether you’re enraged by Ikea’s Verdanagate, want to know what the Beach Boys have in common with easy Jet or why it’s okay to like Comic Sans, «Just My Type» will have the answer. Learn why using upper case got a New Zealand health worker sacked. Refer to Prince in the Tafkap years as a Dingbat (that works on many levels). Spot where movies get their time periods wrong and don’t be duped by fake posters on eBay. Simon Garfield meets the people behind the typefaces and along the way learns why some fonts – like men – are from Mars and some are from Venus. From type on the high street and album covers, to the print in our homes and offices, Garfield is the font of all types of knowledge.

About the Author
Simon Garfield writes for the Observer about science, health and the arts. He is a former editor of Time Out, and his book The End of Innocence won the Somerset Maugham Prize. He has written and edited twelve books, including the bestselling Mass Observation diaries.

——————————————————————————–
Product Details
Hardcover: 352 pages
Publisher: Profile Books Ltd (October 21, 2010)
ISBN-10: 1846683017
ISBN-13: 978-1846683015
Product Dimensions: 8.3 x 5.8 x 1.3 inches
Shipping Weight: 1.2 pounds

Just My Type is a book of stories about fonts. It examines how Helvetica and Comic Sans took over the world. It explains why we are still influenced by type choices made more than 500 years ago, and why the T in the Beatles logo is longer than the other letters. It profiles the great originators of type, from Baskerville to Zapf, as well as people like Neville Brody who threw out the rulebook. The book is about that pivotal moment when fonts left the world of Letraset and were loaded onto computers, and typefaces became something we realized we all have an opinion about. And beyond all this, the book reveals what may be the very best and worst fonts in the world – and what your choice of font says about you.

GRAPHICS: Information is not beautiful

Gracias por visitar el sitio de Juantxo Cruz

Definir la información como ‘bonita’, ‘hermosa’, ‘maravillosa’ o similares no es muy acertado.
Lo que debe definir a la información es la veracidad.
Luego te puede gustar más o menos. Repase cualquier portada de un diario ‘serio’.
La información periodística debe ser dura, jurídica, legal, educativa, instructiva.
Según la RAE, en su tercera acepción, la información es la ‘averiguación jurídica y legal de un hecho’.
La información es investigación.
Jugar con el arte cuando hablamos de información es peligroso y traslada a la infografía al campo del marketing y la publicidad.

PRESS: George Ivan Morrison III

Gracias por visitar el sitio de Juantxo Cruz

Internet es un campo de minas.
Van Morrison ha desmentido la información sobre su futura paternidad con una mujer llamada Gigi Lee. Por lo visto, un pirata informático colgó la información en su página oficial. Ni va a ser padre, ni conoce a tal mujer.

Gracias por visitar el sitio de Juantxo Cruz

Editorial de The Times.
Miércoles 30 de diciembre.
‘Van Morrison has become father at the age of 64’.
Analiza los pros y los contras de ser padre a los 64 años.

Gracias por visitar el sitio de Juantxo Cruz

Información de The Times en página 4.
Recoge pantallazo de la web de Van Morrison en la que se anunciaba que iba a ser padre.

Van Morrison en FACEBOOK.

Página OFICIAL de Van Morrison.

GRAPHICS: Scientific Visualization Studio, NASA

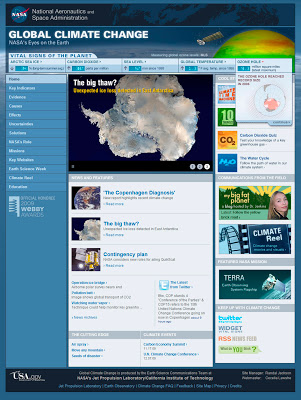
La NASA ha puesto online un paquete multimedia con motivo de la Cumbre del Clima de Copenhague.

Gracias por visitar el sitio de Juantxo Cruz

Una galleria multimedia.
’Climate Essentials’.
Las últimas visualizaciones de la NASA.

Las imágenes se pueden bajar libremente en varios formatos.

Esencial para la NASA:
– El deshielo y los mares
– Groenlandia
– El aumento de la temperatura
– El ozono
– Los huracanas y la temperatura de la superficie de los mares.
– El dióxido de carbono.
– La deforestación.
– La población y el crecimiento de las ciudades.
– La sequía y la agricultura.
– Los incendios.

Gracias por visitar el sitio de Juantxo Cruz

Y el sitio de la NASA dedicado al cambio climático.

GRAPHICS: P2P, feeds y noticias en la red

Gracias por visitar el sitio de Juantxo Cruz

Los usuarios de Internet se suscriben a los medios y blogs por medio de ‘feeds’ (fuentes) que actualizan los contenidos (entradas) que le interesan.

Gracias por visitar el sitio de Juantxo Cruz

Los formatos principales son RSS y Atom.
En XML.

Gracias por visitar el sitio de Juantxo Cruz

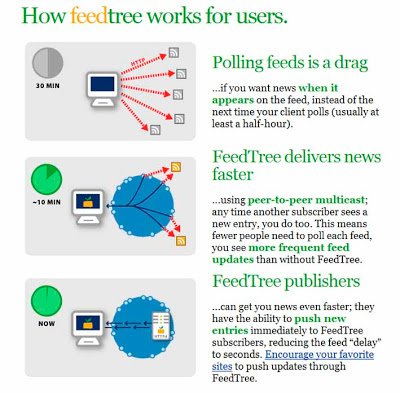
Póster en FeedTree.

Micronoticias cooperativas.
Distribuir las noticias ‘Peer-to-peer’.
No están en un servidor único.
Los nodos se organizan en forma de árbol para distribuir las noticias.
Sin retrasos.
Más rápido.

Gracias por visitar el sitio de Juantxo Cruz

En vez de que el editor ponga sus ‘fuentes’ en un servidor al que acceden los usuarios (al final se ralentiza la distribución), son los clientes los que cooperan compartiendo las fuentes.

Imágenes en FeedTree.

Aquí, documento en inglés que explica el fenómeno.

GRAPHICS: World Resources Institute

World Resource Institute
Un ‘think tank’ para proteger la tierra y el medio ambiente. Desde 1982.
Una organización sin ánimo de lucro con base en Delaware (deducción de tasas, impuestos y donaciones)

Gracias por visitar el sitio de Juantxo Cruz

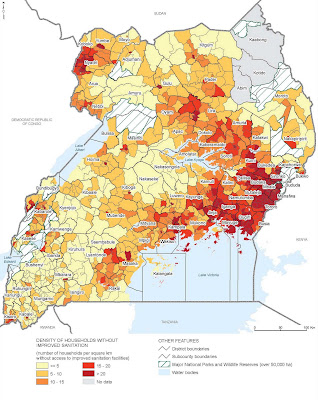
Mapa de Uganda
Densidad de viviendas sin condiciones de salubridad, 2002.

Gracias por visitar el sitio de Juantxo Cruz

Diagrama de las emisiones de gases por sectores en 2005

Gracias por visitar el sitio de Juantxo Cruz

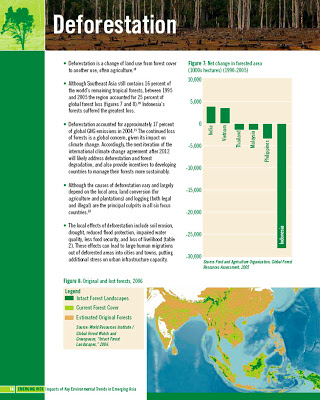
Deforestación en Asia

Gracias por visitar el sitio de Juantxo Cruz

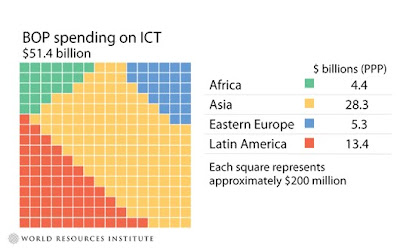
Gasto en tecnologías de la información

Colección de gráficos del WRI

GRAPHICS: ¿Hubo atentado?

Gracias por visitar el sitio de Juantxo Cruz

12 años sin hacer gráficos de atentados del IRA son muchos años. Llega el desgraciado día, un sábado por la noche, y algún editor se acordaría de los infografistas.

Vista la prensa inglesa, parece ser que estaban en la disco. Sólo un gráfico. The Times de Londres. A 7 columnas. Como en los viejos tiempos. Pero el gráfico no anda. Sin firmas, sin fuente, desorganización numérica. 12 años son muchos años.

!Gracias por visitar mi sitio! | Copyright © 1992- 2024 juantxo_cruz. Todos los derechos reservados.