PHOTOS: World Press Photo 2010

Gracias por visitar el sitio de Juantxo Cruz

54 edición.
World Press Photo
Jodi Bieber, Sudáfrica
Retrato de Bibi Aisha, Time Magazine

Her winning picture shows Bibi Aisha, an 18-year-old woman from Oruzgan province in Afghanistan, who fled back to her family home from her husband’s house, complaining of violent treatment. The Taliban arrived one night, demanding Bibi be handed over to face justice. After a Taliban commander pronounced his verdict, Bibi’s brother-in-law held her down and her husband sliced off her ears and then cut off her nose. Bibi was abandoned, but later rescued by aid workers and the American military. After time in a women’s refuge in Kabul, she was taken to America, where she received counseling and reconstructive surgery. Bibi Aisha now lives in the US.

Gracias por visitar el sitio de Juantxo Cruz

Portada del 1 de agosto.

POSTERS: La gran guerra de los medios, 1914-18

Gracias por visitar el sitio de Juantxo Cruz

La guerra de los medios, 1914-18
Exposición en BDIC, París

du 27 octobre 2010 au 16 janvier 2011

Fruit d’un partenariat franco-allemand établi entre la Bibliothèque nationale et universitaire de Strasbourg, la Württembergische Landesbibliothek de Stuttgart, la Bibliothèque nationale de France et la BDIC, cette exposition, qui a déjà été présentée aux publics strasbourgeois et allemand, rassemble les collections de guerre de ces quatre institutions. Celles-ci ont en commun d’avoir su collecter, dès les prémices du conflit, une riche documentation autour de la Grande Guerre.

MAPS: Sequía, 2000-2099, UCAR

Drought under global warning: a review
Aiguo Dai
Publication: Wiley Interdisciplinary Reviews: Climate Change
National Center for Atmospheric Research (NCAR)

The detailed analysis concludes that warming temperatures associated with climate change will likely create increasingly dry conditions across much of the globe in the next 30 years, possibly reaching a scale in some regions by the end of the century that has rarely, if ever, been observed in modern times.

Gracias por visitar el sitio de Juantxo Cruz

Future drought. These four maps illustrate the potential for future drought worldwide over the decades indicated, based on current projections of future greenhouse gas emissions. These maps are not intended as forecasts, since the actual course of projected greenhouse gas emissions as well as natural climate variations could alter the drought patterns.

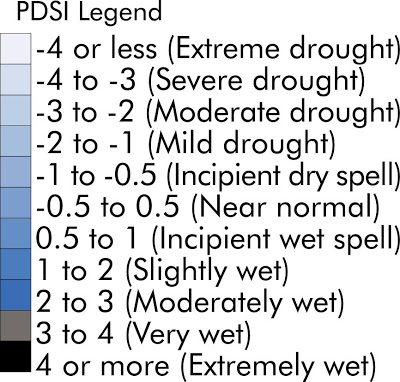
The maps use a common measure, the Palmer Drought Severity Index, which assigns positive numbers when conditions are unusually wet for a particular region, and negative numbers when conditions are unusually dry. A reading of -4 or below is considered extreme drought. Regions that are blue or green will likely be at lower risk of drought, while those in the red and purple spectrum could face more unusually extreme drought conditions. (Courtesy Wiley Interdisciplinary Reviews, redrawn by UCAR. This image is freely available for media use. Please credit the University Corporation for Atmospheric Research.

The University Corporation for Atmospheric Research promotes partnership in a collaborative community dedicated to understanding the atmosphere—the air around us—and the complex processes that make up the Earth system, from the ocean floor to the Sun’s core. more below >

The National Center for Atmospheric Research provides research, observing and computing facilities, and a variety of services for the atmospheric and Earth sciences community. more below >

UCAR Community Programs provide leadership, services, and innovation in support of the community’s education and research goals. more below >

NCAR and the UCAR Community Programs are managed by UCAR, a nonprofit consortium of research universities, on behalf of the National Science Foundation and the university community.

Gracias por visitar el sitio de Juantxo Cruz

THE PALMER DROUGHT SEVERITY INDEX

The Palmer Index was developed by Wayne Palmer in the 1960s and uses temperature and rainfall information in a formula to determine dryness. It has become the semi-official drought index.

The Palmer Index is most effective in determining long term drought—a matter of several months—and is not as good with short-term forecasts (a matter of weeks). It uses a 0 as normal, and drought is shown in terms of minus numbers; for example, minus 2 is moderate drought, minus 3 is severe drought, and minus 4 is extreme drought. At present, northern Virginia is at a minus 4.0 point; north central Maryland is at a minus 4.2 level, and southern Maryland is at least a minus 4 level.

The Palmer Index can also reflect excess rain using a corresponding level reflected by plus figures; i.e., 0 is normal, plus 2 is moderate rainfall, etc. At present, north central Iowa is at a plus 5.2 level, and parts of South Dakota are even higher.

The advantage of the Palmer Index is that it is standardized to local climate, so it can be applied to any part of the country to demonstrate relative drought or rainfall conditions. The negative is that it is not as good for short term forecasts, and is not particularly useful in calculating supplies of water locked up in snow, so it works best east of the Continental Divide.

The Crop Moisture Index (CMI) is also a formula that was also developed by Wayne Palmer subsequent to his development of the Palmer Drought Index.

The CMI responds more rapidly than the Palmer Index and can change considerably from week to week, so it is more effective in calculating short-term abnormal dryness or wetness affecting agriculture.

CMI is designed to indicate normal conditions at the beginning and end of the growing season; it uses the same levels as the Palmer Drought Index.

It differs from the Palmer Index in that the formula places less weight on the data from previous weeks and more weight on the recent week.
Gracias por visitar el sitio de Juantxo Cruz

The Palmer Drought Indices

The Palmer Z Index measures short-term drought on a monthly scale. The Palmer Crop Moisture Index (CMI) measures short-term drought on a weekly scale and is used to quantify drought’s impacts on agriculture during the growing season.

The Palmer Drought Severity Index (PDSI) (known operationally as the Palmer Drought Index (PDI)) attempts to measure the duration and intensity of the long-term drought-inducing circulation patterns. Long-term drought is cumulative, so the intensity of drought during the current month is dependent on the current weather patterns plus the cumulative patterns of previous months. Since weather patterns can change almost literally overnight from a long-term drought pattern to a long-term wet pattern, the PDSI (PDI) can respond fairly rapidly.

The hydrological impacts of drought (e.g., reservoir levels, groundwater levels, etc.) take longer to develop and it takes longer to recover from them. The Palmer Hydrological Drought Index (PHDI), another long-term drought index, was developed to quantify these hydrological effects. The PHDI responds more slowly to changing conditions than the PDSI (PDI).

PHOTOS: Caza Ching-Kuo, made in Taiwan

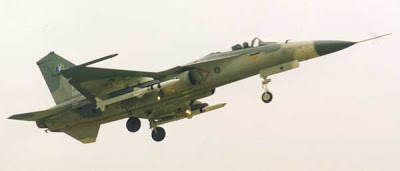
El nuevo caza de las Fuerzas Armadas de Taiwán.
24 millones de dólares.

Gracias por visitar el sitio de Juantxo Cruz


Ching-Kuo Indigenous Defence Fighter
(IDF).

Dimensions:Length 46ft 7.3inWidth30ft 10.78inHeight at Tail15ft 6inEngines:Turbofan Engines2 x TFE1042Thrust41.1KN maximum thrustWeapons:Integrated Avionics and Weapons Control System GunsA20mm M61A Vulcan cannonCameraPhoto-Sonics gun cameraShort-Range Air-to-Air MissilesTien Chien I (Skysword I)Medium-Range Air-to-Air MissilesTien Chien II (Skysword II )Anti-Ship MissilesHsiung Feng II Air-to-Surface MissilesMaverickOthersRocket pods
Bombs
Cluster bombs
Featured Suppliers:

Data Device Corporation – Electronic Components for the Air Force and Military Markets
ISO Group – Spare Parts Logistics for Military Aircraft

Gracias por visitar el sitio de Juantxo Cruz

F-RS-2 Fighter

Con ayuda de EEUU (General Dynamics).
Similar a un F-16, un poco más pequeño.

STATS: The International Institute for Strategic Studies

The International Institute for Strategic Studies
Hechos, análisis, influencia
Think Tank
Arundel House, Londres

Gracias por visitar el sitio de Juantxo Cruz


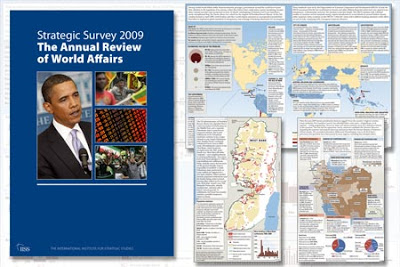
The Anual Review of World Affairs, 2010

Conclusion

Strategic Survey 2010 does not seek to lay out a new comprehensive strategy for Afghanistan. It does however argue that for Western states to be pinned down militarily and psychologically in Afghanistan will not be in the service of their wider political and security interests. The challenge of Afghanistan must be viewed and addressed in proportion to the other threats to international security and the other requirements for foreign-policy investment. With economic, financial and diplomatic activity moving at such a pace and with such varied outcomes internationally, military operations in general have to be all the more carefully considered. Precision and adaptability will be essential watchwords. For heavy, large, military deployment, the longue durée will be seen as an attitude for other times, other centuries.

The Afghan campaign has involved not just mission creep but mission multiplication; narrowing the political-military engagement to core goals as described will allow for proper attention to be paid to other areas posing international terrorist risks, and indeed to other matters affecting international security.

Gracias por visitar el sitio de Juantxo Cruz

The Anual Review of World Affairs, 2009
86-204$

Gracias por visitar el sitio de Juantxo Cruz

The Military Balance 2010
202-437$

Gracias por visitar el sitio de Juantxo Cruz

Mapa de los conflictos mundiales, 2010
10 libras.

Gracias por visitar el sitio de Juantxo Cruz

Diseño de la página digital: TRICKSTER

GRAPHICS: The Blitz, agosto 1940-mayo 1941

70 años de los ataques alemanes al Reino Unido.

Gracias por visitar el sitio de Juantxo Cruz
Carta de Hitler.
Julio de 1940

Gracias por visitar el sitio de Juantxo Cruz

Respuesta de Churchill

Gracias por visitar el sitio de Juantxo Cruz

El plan alemán.

Gracias por visitar el sitio de Juantxo Cruz

Manual nazi para atacar el Reino Unido.
1940

Gracias por visitar el sitio de Juantxo Cruz

Visto en War and Game.

Gracias por visitar el sitio de Juantxo Cruz

Visto en War and Game.

Gracias por visitar el sitio de Juantxo Cruz

Fase II: 24 de agosto-5 de septiembre de 1940

Gracias por visitar el sitio de Juantxo Cruz

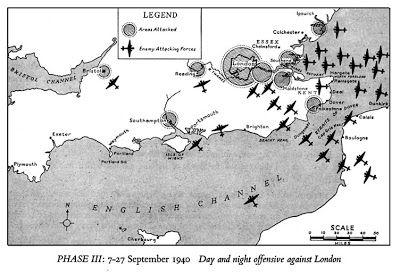
Fase III: Ofensiva en septiembre de 1940

Gracias por visitar el sitio de Juantxo Cruz

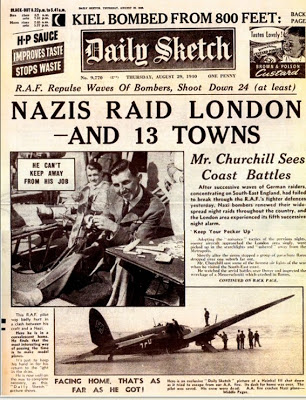
Daily Sketch
16 page tabloid format newspaper replica of original Daily Sketch Newspaper produced on August 29th 1940
Includes stories on war-related events, pictures, black-out times and advertisements
Click on thumbnail for larger image
Gracias por visitar el sitio de Juantxo Cruz


7 de septiembre de 1940

The ‘Blitz’ on Britain’s cities had begun – London would endure 57 nights of bombing without respite. 43,000 civilians would be killed, half of them in London, and more than one million homes destroyed or damaged in London alone. Other cities that were to suffer included Belfast, Bristol, Birmingham, Cardiff, Coventry, Glasgow, Sheffield, Swansea, Liverpool Hull, Manchester, Portsmouth, Plymouth and Southampton.

Gracias por visitar el sitio de Juantxo Cruz


Portada de Life

23 de septiembre de 1940

Gracias por visitar el sitio de Juantxo Cruz

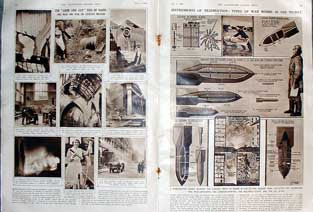
The Illustrated London News, octubre 1940

Gracias por visitar el sitio de Juantxo Cruz

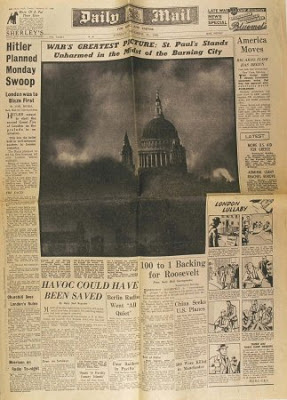
Daily Mail
31 de diciembre de 1940

This edition of the Daily Mail had on its front page a photograph by Herbert Mason of the dome of St. Paul’s Cathedral showing through the smoke from the fires resulting from the severe raid on the City of the night of 29 December 1940. It was captioned as ‘War’s Greatest Picture’. The image of St. Paul’s is undoubtedly now the most well known of the Blitz. It suggests that even then the survival of St. Paul’s had become a symbol of defiance. The accompanying text states that the image is ‘one that all Britain will cherish – for it symbolises the steadiness of London’s stand against the enemy: the firmness of Right against Wrong’. How much was this statement reflecting public opinion and how much was it influencing it?

Gracias por visitar el sitio de Juantxo Cruz

Famosa fotografía de St. Paul
Photographer: Herbert Mason
29 de septiembre de 1940

Gracias por visitar el sitio de Juantxo Cruz

Daños alrededor de St. Paul
This map is an approximation used for demonstration purposes only. O/S maps are required for exact alignment. It is an immediate post Blitz map showing Wren’s London and its bomb damage.The circle appears to have protected St Paul’s Cathedral amazingly well!

Gracias por visitar el sitio de Juantxo Cruz

Clásica fotografía de Corbis.
German Bomber over London
London and the Thames lie vulnerable below a German Heinkels 111 bomber, seen from an escort plane during a bombing raid on July 9, 1940.
IMAGEN:
© CORBIS
FECHA DE LA FOTOGRAFÍA
9 de julio de 1940
LUGAR
London, England, UK
COLECCIÓN
Bettmann

PRESS: Super filtración, WikiLeaks

Gracias por visitar el sitio de Juantxo Cruz

WikiLeaks ha soltado 75.000 informes secretos del ejército de EEUU en Afganistán (2004-2010).

The Guardian, The New York Times y Der Spiegel fueron los afortunados que recibieron directamente la información (WikiLeaks habla de ellos como socios informativos, ‘media partners’).

Gracias por visitar el sitio de Juantxo Cruz

The Guardian le dedica hoy la portada completa y 13 páginas más.

Gracias por visitar el sitio de Juantxo Cruz

Localización precisa de cada combate, amigo o enemigo.
The Guardian.

La verdad sobre Afganistán nunca fue tan bonita como nos la pintaron.

!Gracias por visitar mi sitio! | Copyright © 1992- 2025 juantxo_cruz. Todos los derechos reservados.