Taller de Tableau en la Universidad Europea de Madrid

Universidad Europea de Madrid, 2023

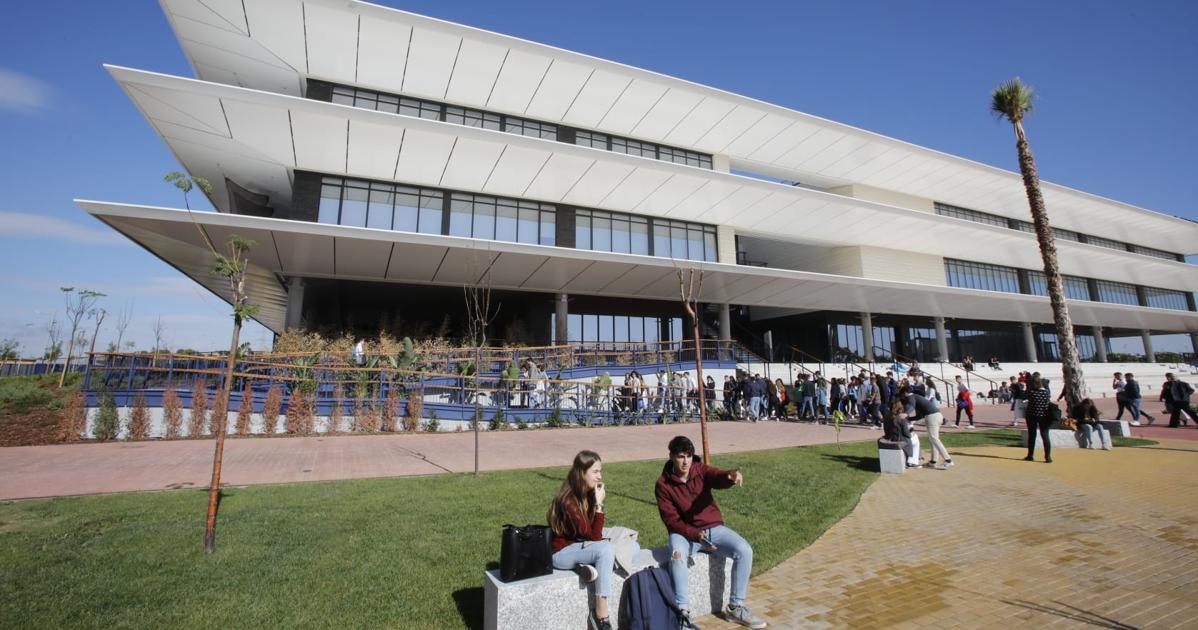
El taller tuvo lugar el jueves 23 de febrero de 2023 en las aulas del Máster Universitario en Comunicación y Emprendimiento Digital de la Facultad de Ciencias Sociales y de la Comunicación de la Universidad Europea de Madrid, que dirige  Carla Esteban Gracia, corresponsal de la cadena de televisión en castellano.

Carla Esteban es Doctora por la Universidad Complutense de Madrid con la tesis La visualización de datos evolución de la infografía en el siglo XXI  2017, dirigida por Dr. Jaime Munárriz Ortiz y, ahora, dirige este interesante Máster.

Visualización de datos con Tableau Software, 2023

Los contenidos versaron sobre:

  • Visualización de datos y gráficos estadísticos.
  • Tipos de datos.
  • Tipos de gráficos.
  • Normas, consejos y ejemplos de publicaciones con gráficos estadísticos.
  • Taller de Tableau, software de Inteligencia de Negocio.

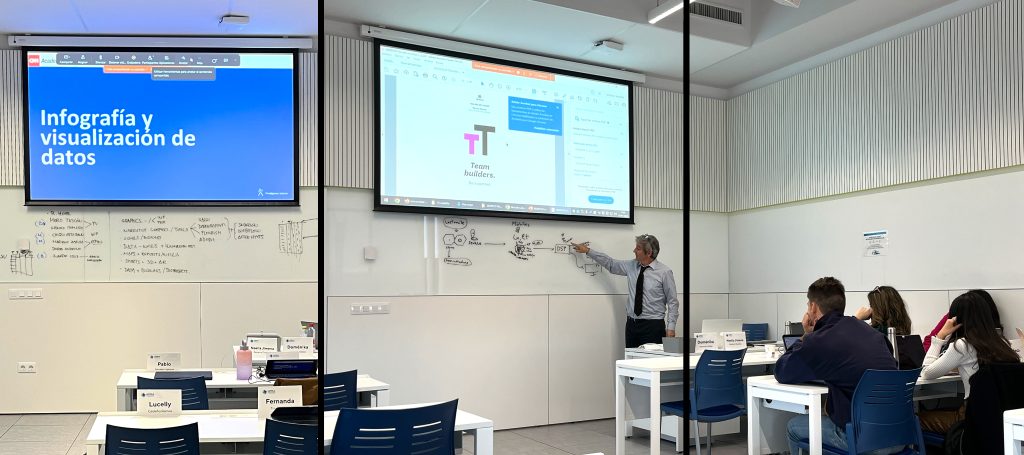
Taller de Tableau. Infografía y Visualización de datos.

Taller de Datawrapper en el Máster en Periodismo Digital Multiplataforma – Universidad Loyola y CNN Academy

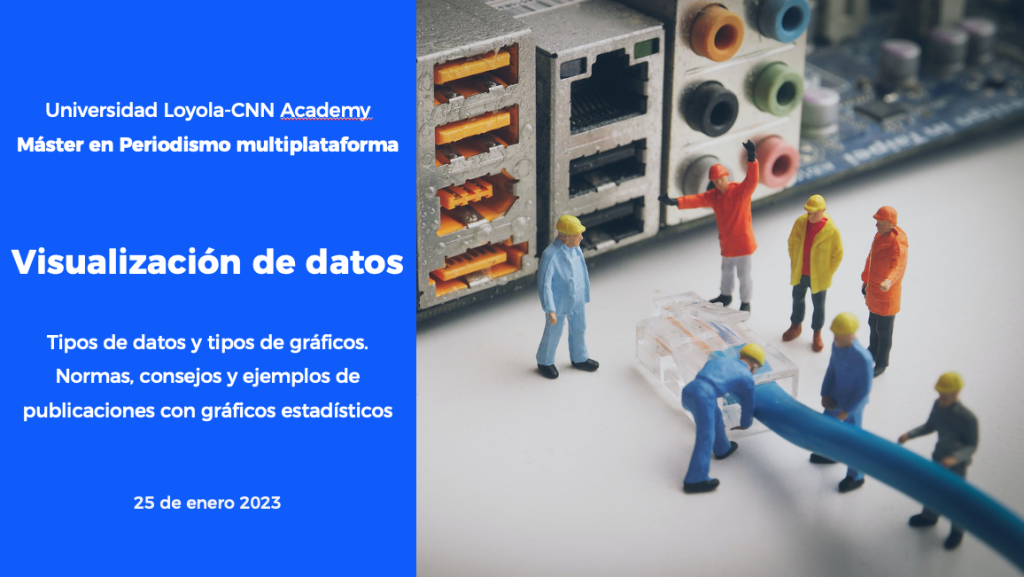
El taller tuvo lugar el martes 25 de enero de 2023 en las aulas del Máster Loyola-CNN en Dos Hermanas (Sevilla), que dirige Francho Barón, corresponsal de la cadena de televisión en castellano.

Gracias a la invitación de Rafa Hohr, estuve en Sevilla impartiendo este taller de cuatro horas sobre tipos de gráficos y Datawrapper para el módulo de Periodismo de Datos y Visualización.

Visualización de datos, 2023

Los contenidos versaron sobre:

  • Visualización de datos y grafícos estadísticos.
  • Tipos de datos.
  • Tipos de gráficos.
  • Taller de Datawrapper
  • Normas, consejos y ejemplos de publicaciones con gráficos estadísticos.

Romina Ishwar Mahtani Mahtani estuvo a cargo de la gestión de la visita. ¡Muchas gracias!

Máster en Periodismo Digital @cnn
@LoyolaMasteres. Infografía y Visualización de datos

Sesión magistral en el Máster en Periodismo Digital Multiplataforma – Universidad Loyola y CNN Academy

Máster en Periodismo Digital Multiplataforma LOYOLA - CNN Academy

Invitado por Rafa Hohr, estuve en Sevilla impartiendo un curso de cuatro horas sobre tipos de gráficos, visualización de datos e infografía para el módulo de Periodismo de Datos y Visualización.

La clase tuvo lugar el martes 18 de enero de 2022 en las aulas del Máster Loyola-CNN en Dos Hermanas (Sevilla), que dirige Francho Barón, corresponsal de la cadena de televisión en castellano.

Presentación sobre gráficos estadísticos, 2022

Los contenidos versaron sobre:

  • Visualización de datos y grafícos estadísticos.
  • Tipos de datos.
  • Tipos de gráficos.
  • Normas, consejos y ejemplos de publicaciones con gráficos estadísticos.

Romina Ishwar Mahtani Mahtani estuvo a cargo de la gestión de la visita. ¡Súper!

Máster en Periodismo Digital @cnn
@LoyolaMasteres. Ejecución de proyectos y claves.

GRAPHICS: Best2010, G20

Gracias por visitar el sitio de Juantxo Cruz

Pulsa aquí.

Videográfico sobre el G20.
Por David Alamenda.

‘La necesidad de sorprender al lector, usuario y espectador (el gráfico es cross-platform) fue una de las máximas de esté gráfico.
La pieza tiene un marcado caracter didáctico, acompañado de datos curiosos y definitorios sobre el G-20. Más allá del lenguaje impreso y de las animaciones interactivas, decidí adentrarme, con mucho respeto, en el lenguaje audiovisual: elaboración de un guión, animaciones, voz en off, nuevas herramientas, estética retro, pero con la clara intención de seguir informando’.

GRAPHICS: eXplorer Statistics, NCVA, Suecia

Gracias por visitar el sitio de Juantxo Cruz

eXplorer Statistics
National Center for Visual Analytics (NCVA)
Suecia
Programación y análisis de la estadística.
«GeoAnalytics Visualization»
Introducción.

Gracias por visitar el sitio de Juantxo Cruz

Usuarios:
The WorlBank
The Economist
The BBC
Eurostat
OCDE
Statistic Denmark
City of Göteborg
Ericsson
Unilever
Gracias por visitar el sitio de Juantxo Cruz

National Center for Visual Analytics (NCVA) is a Swedish national resource funded through the Swedish Knowledge Foundation’s (KK-Stiftelsen) Visualization Program including VINNOVA, SSF, ISA and Vårdalstiftelsen and our industrial and government research partners. NCVA will help to spread geovisual and visual analytics technology into industry and government agencies.
NCVA is managed by Professor Mikael Jern VITA/ITN
Gracias por visitar el sitio de Juantxo Cruz

Strategies
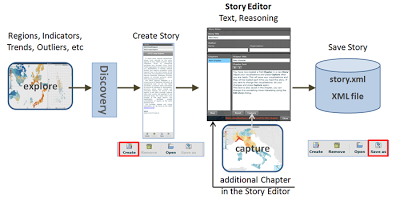
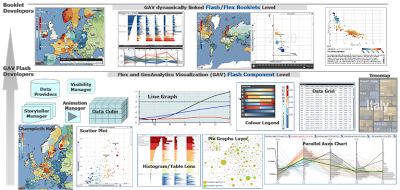
Programming each new Visual Analytics application from scratch is a complex and expensive task and a very inefficient way to work. A high-level toolkit, comprising many well-tested and compatible components, will make this process far less time-consuming and help ensure the correct functioning of each new application produced. To achieve this we build upon our «GeoAnalytics Visualization» framework, GAV, to provide a generic visualization framework for a diverse range of application areas and fully integrated with web tools such as Flash/Flex (GAV Flash) or optimized for performance with Microsoft DirectX (GAV). This framework is designed to provide integrated views of large information spaces, coordinated viewing of information in context, and to approach complex information through the use the overview and detail paradigm. These are the principles behind the VA concept which have made it such a powerful idea in the scientific community. NCVA will show the effectiveness of the technology and provide results in four distinct forms:

1.Valuable applications, addressing key concerns for our partners in industry, public services and academia.
2.New or enhanced methods within GAV framework developed for these purposes but which will then be available to users in other potential areas of interest.
3.Novel techniques to facilitate the recording, review and dissemination of the reasoning within the VA process allowing the analyst to use interactive ‘story-telling’ to convey how conclusions are reached, improving the credibility of the results obtained.
4.New results from evaluation of these applications and techniques in the workplace context, feeding back into new and improved developments in a continuous cycle.
Applied research will be carried out in the context of a number of applications, drawn from diverse areas associated with the activities of the industrial partners, showing the generality of the underlying framework. Each of these applications can also be seen as a demonstrator of the technology. In this work, we will follow a ‘science-to-solutions’ approach to address the entire research, development and deployment process. The strong engagement by industry and public service partners that depend on state-of-the-art VA tools will guarantee that users will be involved from the start and will participate in the definition of the applied research agenda. The partners will, in turn, gain access to front line research, prototypes and components for integrating new and innovative VA tools.

Gracias por visitar el sitio de Juantxo Cruz

Postal addresses

Linköping
All units but the Faculty of Health Sciences
Linköping University
SE-581 83 LINKÖPING
Sweden

Tel: +46 13 28 10 00
Fax: +46 13 14 94 03
e-mail: liu@liu.se
Please notice that questions regarding study programmes, admission, application procedures, enrolment etc, should be sent to studyinfo@liu.se

Faculty of Health Sciences
Hälsouniversitetet
Universitetssjukhuset
SE-581 85 LINKÖPING

Tel: +46 13 22 20 00

Norrköping
All units
Linköping University
Campus Norrkšping
SE-601 74 NORRKÖPING

Tel switchboard: +46 11 36 30 00
Fax: +46 11 26 58 50

Economist: http://www.economist.com/britain-in-context/
OECD: http://www.oecd.org/innovation/strategy/charting
Statistics Denmark: http://www.dst.dk/OmDS/BagTal/Arkiv/2010-05-06-Motorcykler.aspx
OECD: http://vitagate.itn.liu.se/GAV/development/testVislet/
SCB and Eurostat: http://swedeneurostat.blogspot.com/2010/03/education-in-eu-example-with-vislets.html#links
Goteborg City: http://www.samhallsutvecklingen.se/413/stora-inkomstskillnader-i-goteborg/
OECD eXplorer: http://www.ncomva.com/?p=125 (NComVA Vislet demo with OECD eXplorer ageing population in EU 1990-2008).
OECD Factbook: http://www.ncomva.com/?page_id=111 (NComVA Vislet Demo with OECD Factbook – fertility versus women employment rate for 1970-2006)
OECD Regional development: http://www.oecd.org/gov/regional/statisticsindicators
World eXplorer: http://www.ncomva.com/?page_id=297/
3D: Leonar3Do, realidad virtual

Leonar3Do.
Ilustrar en el aire con gafa de 3D y sin ratón.
Desde 2005.
Phoenix, Arizona.

Gracias por visitar el sitio de Juantxo Cruz

Información del producto.

Gracias por visitar el sitio de Juantxo Cruz

Hardware y software

Name of the product: Leonar3Do.
Short description of the product: interactive desktop VR (virtual reality) equipment for personal computer. (Leonar3Do Product description see in the enclosure.)
Purchase price: 750,- EUR / kit (+ 25% VAT, if you order from the territory of the European Union)
Method of payment: Bank transfer. (We send you proform invoice based on your order.)
Shipping deadline: 1 week after the arrival of the purchase price at our bank account. (We send you a message about arrival of the purchase price.)
Method of delivery: delivery onto the granted shipping address (The cost of delivery is charged to 3D for All.).

!Gracias por visitar mi sitio! | Copyright © 1992- 2024 juantxo_cruz. Todos los derechos reservados.