Estudio del sol en 3D.
NASA.
GRAPHICS: Nuevo sistema planetario, NASA
This artist’s conception shows the Kepler-11 planetary system and our solar system from a tilted perspective to demonstrate that the orbits of each lie on similar planes.
Image credit: NASA/Tim Pyle
Kepler’s planets displayed by size comparison.
Image credit: NASA/Wendy Stenzel
MAPS: Topografía lunar, NASA
Nueva topografía de la luna.
NASA.
LOLA topographic map of the moon’s southern hemisphere. The false colors indicate elevation: red areas are highest and blue lowest. Credit: NASA/GSFC/MIT/SVS
The Lunar Orbiter Laser Altimeter (LOLA)
RESEARCH: Mina San José, información digital
Poca información visual la recibida estos días para realizar infografías sobre el rescate de los mineros. Parece increíble la cantidad de gráficos realizados en los medios.
Si alguno de ustedes ha encontrado más referencias visuales oficiales, les agradecería me las enviara.
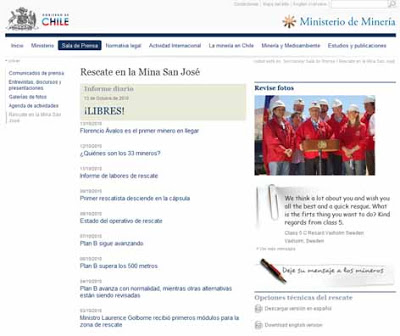
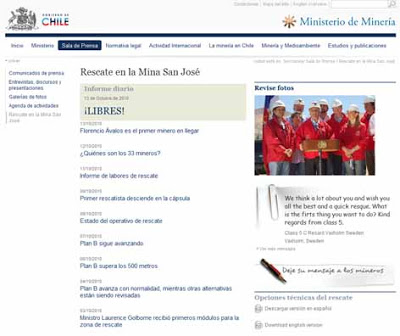
Página oficial Gobierno de Chile.
Los 33 mineros.
Da un parte diario y existe un PDF con información antigua.
Web específica sobre el rescate, con parte diario hasta el día 13 de octubre.
Nada del proyecto, ni de la cápsula, ni de la perforación.
Muy escasa información visual.
Para la Corporación Nacional del Cobre (CODELCO), Digimapas Chile ha levantado topográficamente la mina San José y alrededores con su Sistema Lidar (Laser Aerotransportado) y cámaras digitales de alta resolución en un tiempo record, siendo realizado el vuelo el día viernes 19 de agosto, para luego procesar y entregar los primeros resultados el lunes 23 de Agosto. Entrego un levantamiento topográfico escala 1:1000 en planimetría, curvas de nivel cada 1m, Ortofotos Digitales con 25cm pixel y nubes de puntos clasificadas en coordenadas locales mina.
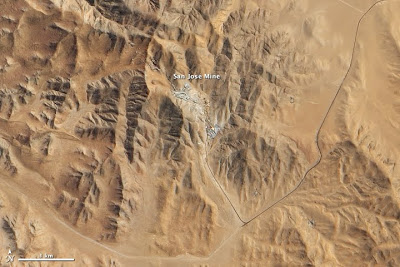
La mina San José, NASA.
In early August 2010, Chile’s San José copper and gold mine collapsed, trapping 33 miners underground. Seventeen days later, the miners’ friends and families were overjoyed to learn that the men had survived. However, the good news came with a caveat: rescuing the miners might take months. They would be an isolated group, living in close quarters, in a potentially deadly environment.
Although they work far above—not below—the surface of the Earth, NASA astronauts endure similar isolation and cramped spaces. In a small contribution to the rescue effort, NASA dispatched a four-person team—two physicians, a psychologist, and an engineer—to Chile to provide support. Invited by the Chilean government, NASA administrators hoped that the agency’s expertise in preparing for emergencies in human spaceflight and sustaining life in a hostile environment could provide benefits to the miners.
The San José mine lies north of Copiapó, Chile, in the world’s driest desert, the Atacama. The Advanced Land Imager (ALI) on NASA’s Earth Observing-1 (EO-1) captured this natural-color image of the mine and its surroundings on September 16, 2010. The mine complex appears as an uneven patch of gray in the midst of camel-colored hills devoid of vegetation. Parts of the Atacama have received no precipitation since recordkeeping began.
As of late August 2010, just two 700-meter (2,300-foot) passageways, each about 23 centimeters (9 inches) in diameter, connected the miners with the world above. Through those tubes, rescue workers could pass food, water, medicine, telephone lines, letters between miners and family members, and games to help pass the time. Before their discovery, the miners had fashioned their own dominoes and opened an underground casino to keep up their spirits.
Before their discovery, the miners kept themselves alive by rationing supplies—about a tablespoon of tuna and ounce or two of milk per day. After 17 days, many were close to starvation. James Polk, one of the NASA physicians visiting the site, explained that providing food to people who had been starving is complicated and must be done cautiously. A rapid reintroduction of calories can cause metabolic changes that quickly turn life threatening.
Equally challenging is the emotional ordeal of spending months in a small group in a confined space. Even before they were found, workers had organized themselves into groups and focused on tasks that would contribute to their rescue, including maintaining their section of the mine and the mining equipment, and mapping their location. The NASA team concluded that the miners and their families were setting an example of resilience. The Chilean government, meanwhile, mounted a rescue operation of unprecedented scope.
Las galerías
Informe oficial del Gobierno
Esto este es el esquema del Gobierno de Chile que se encuentra en la red.
Las perforadoras
Informe oficial del Gobierno
Las tomas de perforación.
Informe oficial del Gobierno
El plan de acción inicial
Informe oficial del Gobierno
La jaula de rescate.
Informe oficial del Gobierno
La jaula la construyó ASMAR (los astilleros de Chile), pero en su página no hay nada.
El diseño sería de CODELCO (Corporación Nacional del Cobre), donde tampoco hay nada.
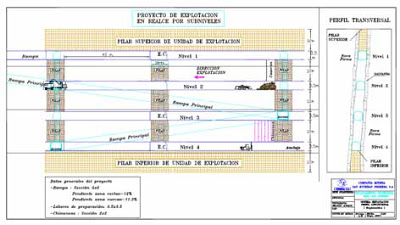
Companía minera de San Esteban
Informe minas, enero 2009
Características de la construcción.
Companía en ruina.
Informe minas, enero 2009
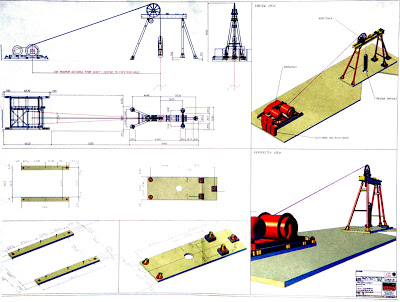
El sistema de polea
Fotografía que pasó Reuters, pero se desconoce el origen.
No está en la web del Gobierno ni en la de la minería.
diagram of the pulley system that will be used to raise the 33 miners individually from the tunnel of the San Jose mine where they have been trapped for weeks is seen at San Jose mine near Copiapo city October 11, 2010. Chilean rescuers on Saturday finished drilling an escape shaft for 33 miners trapped deep underground after a cave-in over two months ago. REUTERS/Handout
Está firmado por: ÖSTU-STETTIN , que realizó el sistema de elevación.
En su web no hay nada.
Headquarter
ÖSTU-STETTIN
Hoch- und Tiefbau GmbH
Münzenbergstraße 38
8700 Leoben
Austria
Tel.: +43 3842 42523
Fax: +43 3842 42523-133
E-Mail: leoben@oestu-stettin.at
www.oestu-stettin.at
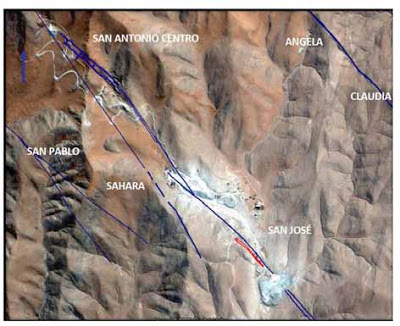
La mina San José y el dispositivo en superficie
De Reuters, parece que la foto la hizo un ‘freelance’.
Tampoco se sabe su origen.
A map of the copper and gold mine where 33 miners are trapped in an accident in August is seen at San Jose mine near Copiapo city October 11, 2010. Rescue workers finished reinforcing an escape shaft on Monday for the trapped miners that should help avoid a last-minute disaster, setting the stage for their evacuation and an end to a two-month ordeal that gripped the world. REUTERS/Stringer
La cápsula de rescate diseñada por la Marina de Chile.
La pasó Reuters, mencionando a la Armada Chilena como el origen.
Pero en la página de la Armada no hay nada.
ASMAR la presentó el 15 de septiembre de 2010.
Edificio Rapa Nui
Prat # 856, Piso 13
Valparaíso, Chile
Mesa Central:
Tel.: (56-32) 226 0000 / Fax: (56-32) 226 0157-8
ASMAR es una Empresa del Estado de Administración Autónoma, del área de la industria naval y de la defensa, cuya actividad principal es satisfacer eficientemente las necesidades de reparaciones, carenas y construcciones de las unidades de la Armada de Chile, y efectuar reparaciones, carenas y construcciones de naves y artefactos navales para terceros nacionales y extranjeros.
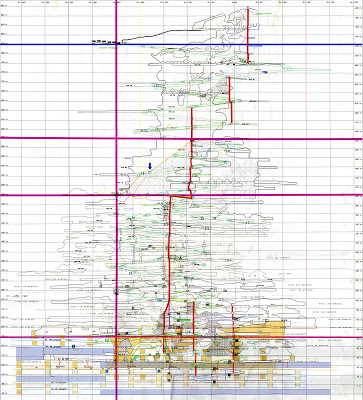
Plano de la mina.
Me lo pasan desde la Tercera de Chile.
Te adjunto la fotografía del plano que hemos utilizado.
FUENTE: Compañía Minera San Esteban Primera S.A.
Título del plano: «Perfil longitudinal Mina San José Primera»
Fecha: Junio 2010
Escala: 1/1000
No tiene página digital.
En InfoMine está la ficha de la empresa. No hay ninguna información al respecto del rescate.
Compañía Minera San Esteban Primera S.A.
Gerente : Sr. Marcelo Kemeny Fuller.
Dirección : Fidel Oteiza 1921 Of. 806 Providencia
F: 2254651
Fax : 2238880 2254648
Fax : (52)212636(Copiapó) 2254630
MAPS: Cráteres de la luna, NASA
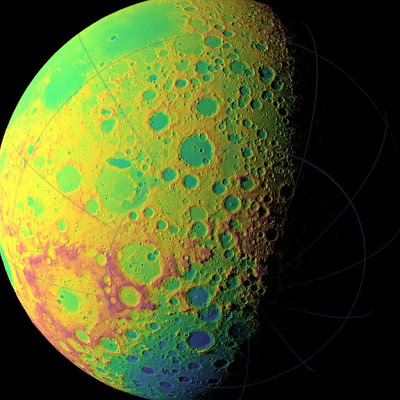
Mapa topográfico de la luna.
Cuando era joven, fue bombardeada por dos poblaciones distintas de asteroides.
Fuente: NASA.
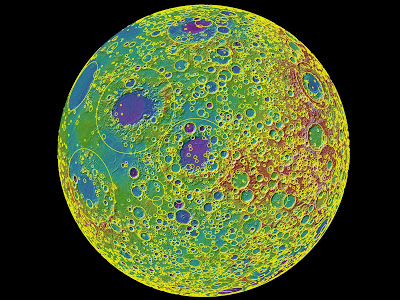
Figure 5: A lunar topographic map showing the Moon from the vantage point of the eastern limb. In this view, the yellow circles represent some of the 5185 craters equal to or greater than 20 km found on the Moon and counted in this study. On the left side of the Moon seen in this view is part of the familiar part of the Moon observed from Earth (the eastern part of the nearside). In the middle left-most part of the globe is Mare Tranquillitatis (light blue) the site of the Apollo 11 landing, and above this an oval-appearing region (Mare Serenitatis; dark blue) the site of the Apollo 17 landing. Most of the dark blue areas are lunar maria, low lying regions composed of volcanic lava flows that formed after the heavily cratered lunar highlands (and are thus much less cratered). The topography is derived from over 2.4 billion shots made by the Lunar Orbiter Laser Altimeter (LOLA) instrument on board the NASA Lunar Reconnaissance Orbiter. The large near-circular basins (large yellow circles) show the effects of the early impacts on early planetary crusts in the inner solar system, including the Earth. Credit: NASA/Goddard/MIT/Brown
GRAPHICS: El traje espacial, NASA
Gráfico interactivo de la NASA sobre el traje espacial y todos sus complementos.
Eso, sí, la presentadora virtual necesita mejorar (bastante).
¿Es Condoleezza o Rachida?
GRAPHICS: Estudios de la nube de ceniza
17 de abril de 2010, NASA
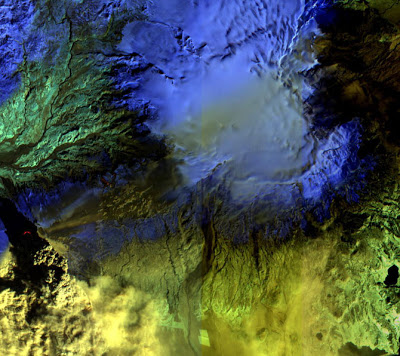
False-color infrared image of Iceland’s Eyjafjallajökull volcano acquired Sat., April 17, 2010, by the Advanced Land Imager (ALI) instrument onboard NASA’s Earth Observing-1 (EO-1) spacecraft. Strong thermal emissions, shown in red, are visible at the base of the ash plume and above and to the right from earlier lava flows located at Fimmvorduhals. Image credit: NASA/JPL/EO-1 Mission/GSFC/Ashley Davies
19 de abril, espectómetro
The Multi-angle Imaging SpectroRadiometer (MISR) instrument on NASA’s Terra satellite captured these different views of the ash plume from Iceland’s erupting Eyjafjallajökull volcano on April 19, 2010, which provide information on the amount and type of particles in the plume itself. Left: a true-color nadir (vertical) view; left-center: a map of retrieved aerosol optical depth, a measure of the amount of particulate matter in the atmosphere; right-center: the Angstrom exponent, which is related to average particle size; right: particle shape. Image credit: NASA/GSFC/LaRC/JPL, MISR Team
A computer-analyzed map of ash plume heights, corrected to compensate for the effects of wind. Reds are highest, blue lowest. Image credit: NASA/GSFC/LaRC/JPL, MISR Team
Photo-like satellite images give us a view of the world that is relatively familiar to us; the images look a lot like a digital photo. But for many scientific studies, a photo-like image doesn’t provide enough information. For example, to predict where the ash from an eruption may spread or how it might interact with clouds, scientists need a mathematical way to describe the concentration of particles in the air.
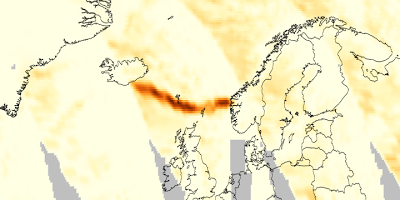
Cloud-Aerosol Lidar and Infrared Pathfinder Satellite Observations (CALIPSO) satellite watches Eyjafjallajökull’s plume drift over northern Europe. Credit: NASA/Kurt Severance and Tim Marvel
GERMAN AEROSPACE CENTER
Resultados del estudio realizado con un Falcon 20E para observar el impacto de las cenizas en el aparato.
Realizado el 19 de abril, publicado el 20.
La prueba fue satisfactoria, en Alemania.
No se apreciaron daños.
On 19 April 2010 the DLR ‘Falcon 20E’ research aircraft took off from Oberpfaffenhofen at 16:00 CEST to examine the ash cloud from the Icelandic volcano Eyafjallajoküll. The route for this measurement flight led from Oberpfaffenhofen to Leipzig, then over Hamburg and on to Bilthoven (the Netherlands) and returned via Stuttgart to Oberpfaffenhofen.
Figure 1: Flight route of the DLR Falcon on 19 April 2010
Figure 2: FLEXPART simulations of the time evolution of an aerosol tracer released from the Iceland volcano (release rate inferred from MSG observations) since 14 April 2010. Total columns (pmol/mol) on 16 April, 15 UTC (a), 17 April, 15 UTC (b), 18 April, 15 UTC, and 19 April, 17 UTC (conditions during the Falcon flight).
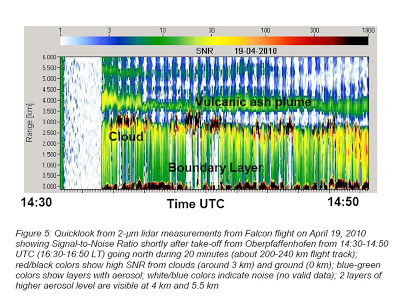
Figure 5: Quicklook from 2-μm lidar measurements from Falcon flight on April 19, 2010 showing Signal-to-Noise Ratio shortly after take-off from Oberpfaffenhofen from 14:30-14:50 UTC (16:30-16:50 LT) going north during 20 minutes (about 200-240 km flight track); red/black colors show high SNR from clouds (around 3 km) and ground (0 km); blue-green colors show layers with aerosol; white/blue colors indicate noise (no valid data); 2 layers of higher aerosol level are visible at 4 km and 5.5 km
PHOTO GEMS: 1946, primera foto desde el espacio
PRIMERA FOTOGRAFÍA desde el espacio.
24 de octubre de 1946
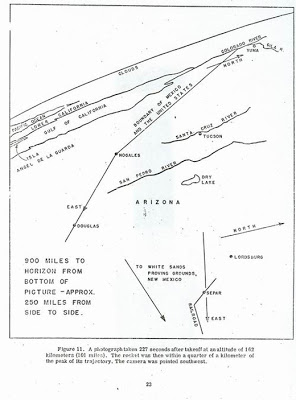
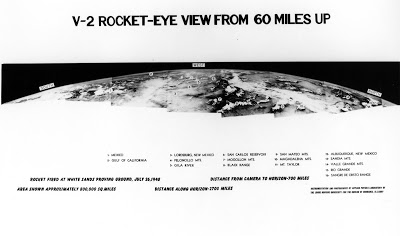
On October 24, 1946, not long after the end of World War II and years before the Sputnik satellite opened the space age, a group of soldiers and scientists in the New Mexico desert saw something new and wonderful—the first pictures of Earth as seen from space.
The grainy, black-and-white photos were taken from an altitude of 65 miles by a 35-millimeter motion picture camera riding on a V-2 missile launched from the White Sands Missile Range. Snapping a new frame every second and a half, the rocket-borne camera climbed straight up, then fell back to Earth minutes later, slamming into the ground at 500 feet per second. The camera itself was smashed, but the film, protected in a steel cassette, was unharme.
Esquema de lo que se ve.
V-2
Vista de 1947, V-2
Composición, julio de 1948
TIROS-1, 50 años (NASA)
1 de abril de 1960
La primera imagen desde Tiros, 1960
GRAPHICS: NASA, Golden Record, Voyager
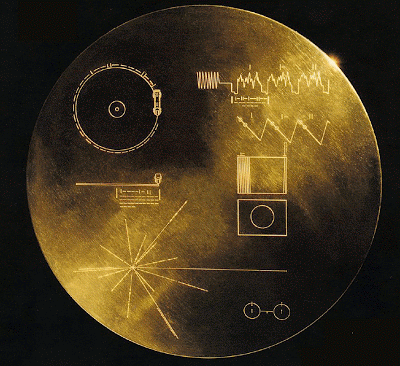
La NASA ha dado a conocer hoy en su página digital las placas de las sondas Voyager.
Imagen del pequeño metal que portaban las cápsulas Voyager 1 y 2 y que contiene un mensaje que, en principio, deberían entender los extraterrestres si las encontrasen perdidas por el espacio.
El mensaje se encuentra en un disco reproducible de oro con sonidos e imágenes de nuestra cultura (animales, música, lenguas, un mensaje de Carter y de otro de la ONU).
Sobre la placa, están incrustadas las instrucciones para hacerlo sonar (ver imagen superior).
Pioneer 10 y 11, precedentes de las misiones Voyager, también portaban una placa de metal con información sobre los humanos.
—————————————————————
Pioneers 10 and 11, which preceded Voyager, both carried small metal plaques identifying their time and place of origin for the benefit of any other spacefarers that might find them in the distant future. With this example before them, NASA placed a more ambitious message aboard Voyager 1 and 2-a kind of time capsule, intended to communicate a story of our world to extraterrestrials. The Voyager message is carried by a phonograph record-a 12-inch gold-plated copper disk containing sounds and images selected to portray the diversity of life and culture on Earth. The contents of the record were selected for NASA by a committee chaired by Carl Sagan of Cornell University, et. al. Dr. Sagan and his associates assembled 115 images and a variety of natural sounds, such as those made by surf, wind and thunder, birds, whales, and other animals. To this they added musical selections from different cultures and eras, and spoken greetings from Earth-people in fifty-five languages, and printed messages from President Carter and U.N. Secretary General Waldheim. Each record is encased in a protective aluminum jacket, together with a cartridge and a needle. Instructions, in symbolic language, explain the origin of the spacecraft and indicate how the record is to be played. The 115 images are encoded in analog form. The remainder of the record is in audio, designed to be played at 16-2/3 revolutions per minute. It contains the spoken greetings, beginning with Akkadian, which was spoken in Sumer about six thousand years ago, and ending with Wu, a modern Chinese dialect. Following the section on the sounds of Earth, there is an eclectic 90-minute selection of music, including both Eastern and Western classics and a variety of ethnic music. Once the Voyager spacecraft leave the solar system (by 1990, both will be beyond the orbit of Pluto), they will find themselves in empty space. It will be forty thousand years before they make a close approach to any other planetary system. As Carl Sagan has noted, «The spacecraft will be encountered and the record played only if there are advanced spacefaring civilizations in interstellar space. But the launching of this bottle into the cosmic ocean says something very hopeful about life on this planet.»
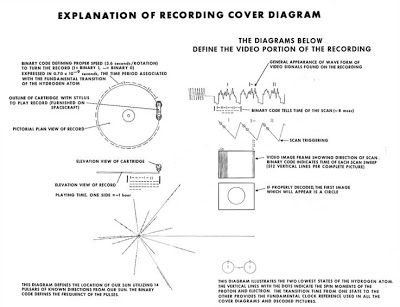
Diagrama explicativo.
—————————————————————
«In the upper left-hand corner is an easily recognized drawing of the phonograph record and the stylus carried with it. The stylus is in the correct position to play the record from the beginning. Written around it in binary arithmetic is the correct time of one rotation of the record, 3.6 seconds, expressed in time units of 0,70 billionths of a second, the time period associated with a fundamental transition of the hydrogen atom. The drawing indicates that the record should be played from the outside in. Below this drawing is a side view of the record and stylus, with a binary number giving the time to play one side of the record – about an hour.
«The information in the upper right-hand portion of the cover is designed to show how pictures are to be constructed from the recorded signals. The top drawing shows the typical signal that occurs at the start of a picture. The picture is made from this signal, which traces the picture as a series of vertical lines, similar to
ordinary television (in which the picture is a series of horizontal lines). Picture lines 1, 2 and 3 are noted in binary numbers, and the duration of one of the «picture lines,» about 8 milliseconds, is noted. The drawing immediately below shows how these lines are to be drawn vertically, with staggered «interlace» to give the correct picture rendition. Immediately below this is a drawing of an entire picture raster, showing that there are 512 vertical lines in a complete picture. Immediately below this is a replica of the first picture on the record to permit the recipients to verify that they are decoding the signals correctly. A circle was used in this picture to insure that the recipients use the correct ratio of horizontal to vertical height in picture reconstruction.
«The drawing in the lower left-hand corner of the cover is the pulsar map previously sent as part of the plaques on Pioneers 10 and 11. It shows the location of the solar system with respect to 14 pulsars, whose precise periods are given. The drawing containing two circles in the lower right-hand corner is a drawing of the hydrogen atom in its two lowest states, with a connecting line and digit 1 to indicate that the time interval associated with the transition from one state to the other is to be used as the fundamental time scale, both for
the time given on the cover and in the decoded pictures.
«Electroplated onto the record’s cover is an ultra-pure source of uranium-238 with a radioactivity of about 0.00026 microcuries. The steady decay of the uranium source into its daughter isotopes makes it a kind of radioactive clock. Half of the uranium-238 will decay in 4.51 billion years. Thus, by examining this two-centimeter diameter area on the record plate and measuring the amount of daughter elements to the remaining uranium-238, an extraterrestrial recipient of the Voyager spacecraft could calculate the time elapsed since a spot of uranium was placed aboard the spacecraft. This should be a check on the epoch of launch, which is also described by the pulsar map on the record cover.»
PHOTO: Haití, terremoto y puerto, NASA
Haiti: 7.0 Quake Near Port Au Prince (as of 21 Jan 2010)
Imágenes NASA terremto
The Advanced Spaceborne Thermal Emission and Reflection Radiometer (ASTER) instrument on NASA’s Terra spacecraft captured this false color image of Haiti, on January 21, 2010, nine days after a magnitude 7.0 earthquake struck the region and caused massive damage and loss of life, and one day after a large 5.9 aftershock caused additional damage. While ASTER’s 15-meter (50-foot) resolution is not sufficient to see damaged buildings, it can be used to identify other results of the shaking. Tiny dots of white against the plant-covered landscape (red in this image) are possible landslides, a common occurrence in mountainous terrain after large earthquakes. The possible landslides were identified by carefully comparing the new image with an image acquired one year previously.
Port-au-Prince, Haiti’s capital, is silver in the false color image. The rivers are pale blue, while the ocean is dark blue. Exposed soil is white.
NASA Earth Observatory image created by Jesse Allen, using data provided courtesy of NASA/GSFC/METI/ERSDAC/JAROS, and U.S./Japan ASTER Science Team. Caption adapted from the Jet Propulsion Laboratory Photojournal.
Instrument:
Terra – ASTER
Los barcos en Puerto Príncipe
Imágenes NASA terremto
Ships carrying relief supplies and aid stream into Port-au-Prince, Haiti, in this image taken by the Advanced Spaceborne Thermal Emission and Reflection Radiometer (ASTER) on NASA’s Terra satellite on January 21, 2010. The city’s port was badly damaged in the massive 7.0 earthquake that hit the island on January 12. On January 20, one pier re-opened, allowing ships to dock for the first time since the earthquake, said news reports.
The newly reopened pier is the city’s south pier, the narrow strip that juts out into the water in this image. Part of the pier collapsed in the earthquake, but the remaining structure is just stable enough to support a single truck offloading supplies from docked ships, reported CNN.
Tiny streaks of white in the dark blue water are ships. The largest ship in the scene may be the USNS Comfort, a 273-meter (894-foot) long U.S. Navy hospital ship that was taking patients by helicopter until a pier could open up, according to Business Week.
Though its capacity is limited, the fragile pier should speed the distribution of food and other supplies to earthquake victims. Prior to January 20, aid had been coming into Port-au-Prince on airplanes arriving on a single runway, said news reports. The ships have a much greater capacity.
Port-au-Prince itself is blue gray in this false color image. At this scale, the only visible earthquake damage is the shortened pier, but the image does reveal how densely constructed the city was. Plant-covered land is red. Little open, plant-covered ground can be seen in the heart of the city.
1. References
2. CNN. (2010, January 21). Haiti pier opens, road laid into Port-au-Prince. Accessed January 21, 2010.
3. Dolmetsch, C, and Varner, B. (2010, January 21). U.S.-rescued Haitian Victims Treated on Hospital Ship. Business Week. Accessed January 21, 2010.
4. Leonard, T. (2010, January 20). Haiti earthquake: damaged port reopens to aid ships. Telegraph. Accessed January 21, 2010.
5. Military Seacraft Command. USNS Comfort. Accessed January 21, 2010.
NASA Earth Observatory image created by Jesse Allen, using data provided courtesy of NASA/GSFC/METI/ERSDAC/JAROS, and U.S./Japan ASTER Science Team. Caption by Holli Riebeek.
Instrument:
Terra – ASTER


