GRAPHICS: Emisiones de CO2, CDIAC

Carbon Dioxide Information Analysis Center

The Carbon Dioxide Information Analysis Center (Thomas A. Boden, Director), which includes the World Data Center for Atmospheric Trace Gases, has served as the primary climate-change data and information analysis center of the U.S. Department of Energy (DOE) since 1982.

Gracias por visitar el sitio de Juantxo Cruz

EEUU
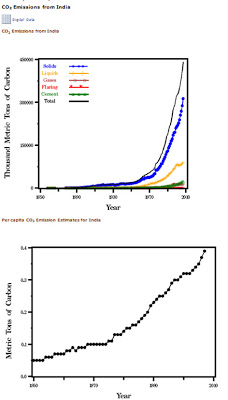
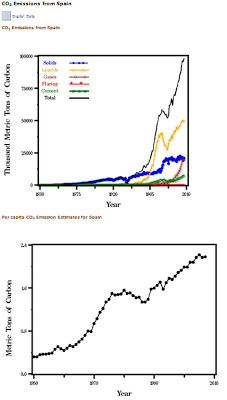
Total y per cápita, toneladas métricas de carbón

Gracias por visitar el sitio de Juantxo Cruz

China

Gracias por visitar el sitio de Juantxo Cruz

India

Gracias por visitar el sitio de Juantxo Cruz

España

Gracias por visitar el sitio de Juantxo Cruz

Magnifica visualización actualizada en la portada de hoy del Washington Post.

Gracias por visitar el sitio de Juantxo Cruz

En internet.

GRAPHICS: Huella ecológica, WWF

Gracias por visitar el sitio de Juantxo Cruz

Living Planet Report

Publication details
Published in October 2010 by WWF – World Wide
Fund For Nature (Formerly World Wildlife Fund),
Gland, Switzerland. Any reproduction in full or in
part of this publication must mention the title and
credit the above-mentioned publisher as the
copyright owner.

© Text and graphics: 2010 WWF
All rights reserved
The material and the geographical designations in
this report do not imply the expression of any opinion
whatsoever on the part of WWF concerning the legal
status of any country, territory, or area, or concerning
the delimitation of its frontiers or boundaries.

Gracias por visitar el sitio de Juantxo Cruz

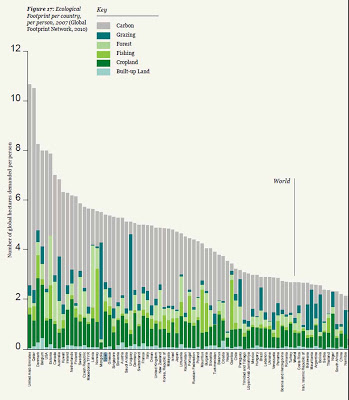
La huella ecológica.
1961-2007
La biocapacidad total sería un planeta Tierra.

Gracias por visitar el sitio de Juantxo Cruz

La productividad del planeta se come todos los recursos para regenerarla (1,5 tierras).
Enemigo número 1: el carbón.

MAPS: Census of Marine Life

Gracias por visitar el sitio de Juantxo Cruz

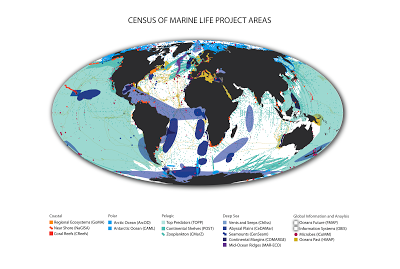
El primer censo marino.
First Census of Marine Life 2010: Highlights of a Decade of Discovery

INTERACTIVO.

OTROS MAPAS.

Gracias por visitar el sitio de Juantxo Cruz

NATIONAL GEOGRAPHIC

The Census of Marine Life is a global network of researchers in more than 80 nations engaged in a 10-year scientific initiative to assess and explain the diversity, distribution, and abundance of life in the oceans. The world’s first comprehensive census of the past, present, and future of life in the oceans is being released in 2010.

The Mapping and Visualization Team based at Duke University’s Marine Geospatial Ecology Lab is responsible for developing and sharing methods to display the results of the ten-year Census of Marine Life. Most Census projects are developing their own maps and visualizations.

The following images highlight a variety of maps and visualizations resources produced by the Census projects. Additional information can be found on each individual Census project website.

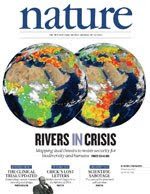
MAPS: Agua en peligro, Nature

Gracias por visitar el sitio de Juantxo Cruz

Portada de Nature

The security of water supply for humans and the biodiversity of rivers are often seen as competing goals, but need that be the case? A new global-scale analysis of freshwater resources advances the field by considering threats to both river biodiversity (on the left on the cover) and to human water security, after accounting for investments in infrastructure and water services (right). The maps reveal that the world’s rivers are in a state of crisis. Achieving a sustainable solution to these problems, the authors say, will require strategies that jointly address water security for humans and biodiversity. COVER CREDIT: Stanley Glidden

Gracias por visitar el sitio de Juantxo Cruz

Amenazas a la biodiversidad.
El 80% de la población de la Tierra está expuesta al impacto de la falta de seguridad sobre el agua.

The maps demonstrate pandemic impacts on both human water security and biodiversity and are highly coherent, although not identical (biodiversity threat = 0.964 × human water security threat + 0.018; r = 0.97, P 

VIDEO: 25.000 barriles de petróleo x 4=BP

Son muchos barriles.
1 barril=150 kilos=159 litros

BP estima que el vertido en el Golfo de México podría llegar a 100.000 barriles de petróleo al día.
Son 15,9 millones de litros al día.
Son 15.000 toneladas al día.
REUTERS.

Hasta ahora, el gobierno EEUU admitía 60.000 barriles al día.
Worst Case Scenario.

Prestige:
77.000 toneladas.
513.333 barriles.

BP estaría vertiendo 1 Prestige cada cinco días.

!Gracias por visitar mi sitio! | Copyright © 1992- 2024 juantxo_cruz. Todos los derechos reservados.