STATS: Cuantiles, INE

Decil de salarios del empleo principal. Encuesta de Población Activa (EPA)
Años 2006–2009
INE

Gracias por visitar el sitio de Juantxo Cruz

CUANTILES (o «cuantilas»): son medidas de posición que se determinan mediante un método que determina la ubicación de los valores que dividen un conjunto de observaciones en partes iguales.
Se puede dividir la distribución en cuatro, en diez o en cien partes.

MEDIANAS: divide a un conjunto de valores dados en dos partes iguales, y su posición es, en consecuencia, a la mitad del mismo.

CUARTILES (o «cuartila»): cuando dividen la distribución en cuatro partes.

Los DECILES (o «decila») son los nueve valores que dividen una serie de datos en diez partes iguales.
Los deciles dan los valores correspondientes al 10%, al 20%… y al 90% de los datos.

CENTILES o PERCENTILES (o «centila»): son ciertos números que dividen la sucesión de datos ordenados en cien partes porcentualmente iguales.

METODOLOGÍA INE:
Para calcular los deciles salariales se procede de la siguiente forma: se ordenan todos los asalariados según la cuantía del salario mensual percibido y se dividen después en diez grupos iguales, es decir, con el 10% de los trabajadores en cada grupo. El primer decil salarial corresponde al primer grupo de trabajadores, o sea al 10% con menores salarios; el segundo, al 10% siguiente, y así sucesivamente hasta llegar al décimo decil correspondiente al 10% de trabajadores con mayores ingresos. Cada decil viene definido por su media (salario medio del grupo) y por los salarios inferior y superior que lo delimitan.

Gracias por visitar el sitio de Juantxo Cruz

Las diferencias entre el sector público y privado.
Así, en el sector público el grupo que gana más de 2.489 euros al mes supone el 46,8% del total de asalariados.
En el sector privado, son el 13,5%.

Y en las rentas bajas, en el sector público, los que ganan entre 707 euros y 1.000 euros son un 6% mientras que, en el sector privado, son un 23,4%.

Explicación del INE: ‘La pérdida de empleo en el sector privado asociada a la situación económica y el nivel de estudios superior exigido en buena parte del sector público explica esta evolución’.

Así, uno: en el sector público no se pierde empleo.
Dos: ¿nivel de estudios superior?

MAPS: Sequía, 2000-2099, UCAR

Drought under global warning: a review
Aiguo Dai
Publication: Wiley Interdisciplinary Reviews: Climate Change
National Center for Atmospheric Research (NCAR)

The detailed analysis concludes that warming temperatures associated with climate change will likely create increasingly dry conditions across much of the globe in the next 30 years, possibly reaching a scale in some regions by the end of the century that has rarely, if ever, been observed in modern times.

Gracias por visitar el sitio de Juantxo Cruz

Future drought. These four maps illustrate the potential for future drought worldwide over the decades indicated, based on current projections of future greenhouse gas emissions. These maps are not intended as forecasts, since the actual course of projected greenhouse gas emissions as well as natural climate variations could alter the drought patterns.

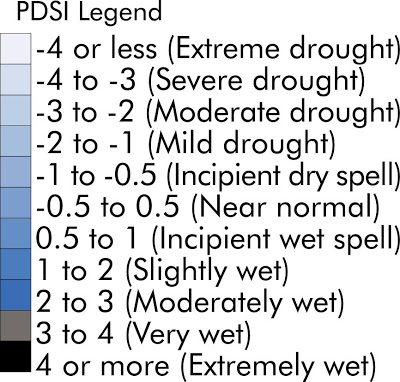
The maps use a common measure, the Palmer Drought Severity Index, which assigns positive numbers when conditions are unusually wet for a particular region, and negative numbers when conditions are unusually dry. A reading of -4 or below is considered extreme drought. Regions that are blue or green will likely be at lower risk of drought, while those in the red and purple spectrum could face more unusually extreme drought conditions. (Courtesy Wiley Interdisciplinary Reviews, redrawn by UCAR. This image is freely available for media use. Please credit the University Corporation for Atmospheric Research.

The University Corporation for Atmospheric Research promotes partnership in a collaborative community dedicated to understanding the atmosphere—the air around us—and the complex processes that make up the Earth system, from the ocean floor to the Sun’s core. more below >

The National Center for Atmospheric Research provides research, observing and computing facilities, and a variety of services for the atmospheric and Earth sciences community. more below >

UCAR Community Programs provide leadership, services, and innovation in support of the community’s education and research goals. more below >

NCAR and the UCAR Community Programs are managed by UCAR, a nonprofit consortium of research universities, on behalf of the National Science Foundation and the university community.

Gracias por visitar el sitio de Juantxo Cruz

THE PALMER DROUGHT SEVERITY INDEX

The Palmer Index was developed by Wayne Palmer in the 1960s and uses temperature and rainfall information in a formula to determine dryness. It has become the semi-official drought index.

The Palmer Index is most effective in determining long term drought—a matter of several months—and is not as good with short-term forecasts (a matter of weeks). It uses a 0 as normal, and drought is shown in terms of minus numbers; for example, minus 2 is moderate drought, minus 3 is severe drought, and minus 4 is extreme drought. At present, northern Virginia is at a minus 4.0 point; north central Maryland is at a minus 4.2 level, and southern Maryland is at least a minus 4 level.

The Palmer Index can also reflect excess rain using a corresponding level reflected by plus figures; i.e., 0 is normal, plus 2 is moderate rainfall, etc. At present, north central Iowa is at a plus 5.2 level, and parts of South Dakota are even higher.

The advantage of the Palmer Index is that it is standardized to local climate, so it can be applied to any part of the country to demonstrate relative drought or rainfall conditions. The negative is that it is not as good for short term forecasts, and is not particularly useful in calculating supplies of water locked up in snow, so it works best east of the Continental Divide.

The Crop Moisture Index (CMI) is also a formula that was also developed by Wayne Palmer subsequent to his development of the Palmer Drought Index.

The CMI responds more rapidly than the Palmer Index and can change considerably from week to week, so it is more effective in calculating short-term abnormal dryness or wetness affecting agriculture.

CMI is designed to indicate normal conditions at the beginning and end of the growing season; it uses the same levels as the Palmer Drought Index.

It differs from the Palmer Index in that the formula places less weight on the data from previous weeks and more weight on the recent week.
Gracias por visitar el sitio de Juantxo Cruz

The Palmer Drought Indices

The Palmer Z Index measures short-term drought on a monthly scale. The Palmer Crop Moisture Index (CMI) measures short-term drought on a weekly scale and is used to quantify drought’s impacts on agriculture during the growing season.

The Palmer Drought Severity Index (PDSI) (known operationally as the Palmer Drought Index (PDI)) attempts to measure the duration and intensity of the long-term drought-inducing circulation patterns. Long-term drought is cumulative, so the intensity of drought during the current month is dependent on the current weather patterns plus the cumulative patterns of previous months. Since weather patterns can change almost literally overnight from a long-term drought pattern to a long-term wet pattern, the PDSI (PDI) can respond fairly rapidly.

The hydrological impacts of drought (e.g., reservoir levels, groundwater levels, etc.) take longer to develop and it takes longer to recover from them. The Palmer Hydrological Drought Index (PHDI), another long-term drought index, was developed to quantify these hydrological effects. The PHDI responds more slowly to changing conditions than the PDSI (PDI).

GRAPHICS: Reforma de las pensiones, FEDEA

Hacia un sistema público de pensiones sostenible, equitativo y transparente
7 oct. 2010

FEDEA-Fundación de Estudios de Economía Aplicada-
Desde 1985
Fábrica de ideas.

Gracias por visitar el sitio de Juantxo Cruz

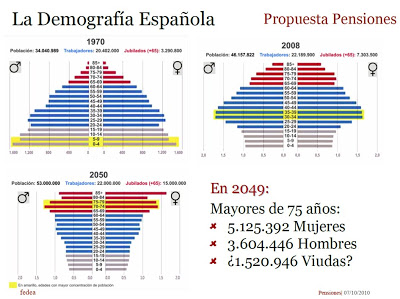
La pirámide insostenible. 2050.

Gracias por visitar el sitio de Juantxo Cruz

Según Fedea, la reforma es inevitable.
Hoy hay 4 personas trabajando por cada pensionistas.
En 2040, serán dos personas por pensionista.

Sus propuestas:

1.La pensión de jubilación tiene que ser proporcional a las cotizaciones efectivamente realizadas a lo largo de toda la vida laboral.

2.La edad de jubilación debe ser flexible y la pensión debe depender de la esperanza de vida en el momento de la jubilación.

3. Ante nuevos cambios demográficos y socioeconómicos, el sistema de pensiones debe contener elementos de ajuste automático.

Promotores
•Alfonso Arellano (FEDEA)
•Michele Boldrin (FEDEA y WuT)
•Juan Carlos Conesa (UAB)
•Javiér Diáz-Giménez (IESE)
•Juanjo Dolado (UC3M)
•Rafael Domenech (UV)
•Florentino Felgueroso (FEDEA)
•Angel de la Fuente (CSIC)
•Vincenzo Galasso (Bocconi)
•José Ignacio Garcia (UPO)
•Luis Garicano (FEDEA y LSE)
•José Antonio Herce (AFI)
•Sergi Jiménez (FEDEA y UPF)
•Cesar Molinas (Multa Paucis)
•Ana Montes (UM)
•Cio Patxot (UB)
•Juan Rubio (FEDEA y Duke)
•Alfonso Sánchez (UPO)
•Virginia Sánchez (UNICAN)
•Pablo Vázquez (FEDEA)

Gracias por visitar el sitio de Juantxo Cruz

Contribuciones.

STATS: Objetivo del Milenio, 0,7%

The Global Partnership for Development at a Critical Juncture
Desde 2000, objetivos del Milenio.
MDG Gap Task Force Report 2010
United Nations

Gracias por visitar el sitio de Juantxo Cruz

Resumen de la ayuda al desarrollo, 2004-2009

Gracias por visitar el sitio de Juantxo Cruz

Los receptores, 2000-2008

Gracias por visitar el sitio de Juantxo Cruz

Asistencia al desarrollo, 2009
España: 6.570 millones de dólares, los sextos.
Canadá (-10%), Alemania(-12%), Italia (-31%) y Japón (-11%) son países que han reducido su ayuda con respecto al año anterior.

Donaciones totales en 2009: 120.000 millones de dólares (0,3% por país donante).
Objetivo 2015: 0,7%, 300.000 millones de dólares.

Gracias por visitar el sitio de Juantxo Cruz

En porcentaje del PIB, 2009
España: 0,46%, puesto 12.

Gracias por visitar el sitio de Juantxo Cruz

Los objetivos.

—————————————————–
The United Nations Millennium Declaration called on the industrialized countries
to grant more generous development assistance, especially to those countries
that are genuinely making an effort to apply their resources to poverty
reduction.1 This two-track strategy of increasing aid volumes and making aid
more effective in generating poverty reduction and meeting the other Millennium
Development Goals (MDGs) has characterized much of international
policy on official development assistance (ODA) since the beginning of the
millennium.

United Nations publication
Sales No. E.10.I.12
ISBN 978-92-1-101224-8
© Copyright United Nations, 2010
All rights reserved

STATS: The Global Competitiveness Report 2010-2011

Gracias por visitar el sitio de Juantxo Cruz

The Global Competitiveness Report 2010-2011
World Economic Forum

Professor Xavier Sala-i-Martin
Columbia University
Chief Advisor of the Centre for Global Competitiveness and Performance

‘Partner’ en España:
IESE Business School, International Center for Competitiveness
Antoni Subirà, Professor
María Luisa Blázquez, Research Associate

Gracias por visitar el sitio de Juantxo Cruz

España, al puesto 42 (de 139 países).

‘Spain has dropped nine ranks this year to 42nd
place. The decline is in large part attributable to an
increasingly negative assessment of the labor and financial
markets as well as the level of sophistication of the country’s
businesses. On a more positive note, Spain’s competitiveness
performance continues to be boosted by the
large market (13th) available to its national companies,
strong technological adoption (30th in the technological
readiness pillar), first-class infrastructure (14th), and good
higher education and training (31st). Overall, the greatest
area of concern remains the highly inflexible labor market
(130th on the related subpillar), which discourages
job creation—a matter of particular concern considering
the high and persistent unemployment in the country.’

Gracias por visitar el sitio de Juantxo Cruz

Los europeos.

Gracias por visitar el sitio de Juantxo Cruz

Los problemas de España.

Gracias por visitar el sitio de Juantxo Cruz

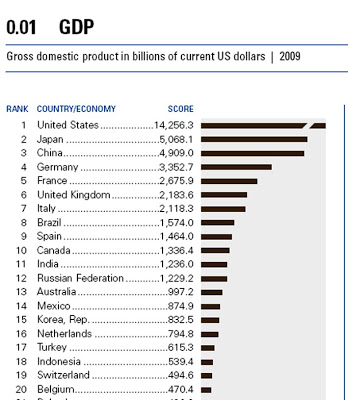
Pese a tener el noveno PIB mundial…

Gracias por visitar el sitio de Juantxo Cruz

…estamos en el puesto 23 per cápita.

Seventh pillar: Labor market efficiency
The efficiency and flexibility of the labor market are critical
for ensuring that workers are allocated to their most
efficient use in the economy and provided with incentives
to give their best effort in their jobs. Labor markets must
therefore have the flexibility to shift workers from one
economic activity to another rapidly and at low cost, and
to allow for wage fluctuations without much social disruption.
14The importance of the latter has been dramatically
highlighted by the difficulties countries with particularly
rigid labor markets—such as Spain—have encountered
in recovering from the recent major economic
downturn.
Efficient labor markets must also ensure a clear relationship
between worker incentives and their efforts, as
well as equity in the business environment between
women and men.

!Gracias por visitar mi sitio! | Copyright © 1992- 2025 juantxo_cruz. Todos los derechos reservados.