JasperReports: Documentos y visualizaciones flexibles

Río Arga, Pamplona.

JasperReports (actualmente TIBCO Jaspersoft Studio, Palo Alto, California) es una aplicación de software libre (versión Community) escrita en Java (Eclipse) para crear informes con contenido dinámico.

iReport es el front-end gráfico de código abierto para la edición de informes —una herramienta para diseñar las páginas flexibles del documento desarrollada desde 2001—. Actualmente cuenta con más de 50 tipos de gráficos distintos, tablas, imágenes y mapas.


Formatos de exportación de Jaspersoft Studio.


Tipos de gráficos en Jaspereports en la versión 4, 2010
Tipos de gráficos en JasperReports en la versión 4, 2010


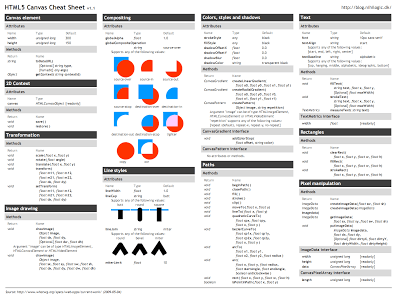
Tipos de gráficos HTML5, versión 6, 2016


Los gráficos HTML5 (en la versión profesional) se pueden personalizar utilizando  propiedades para el control del nivel de píxel sobre cada visualización.

Jaspersoft Studio utiliza el lenguaje de consulta de sus fuentes de datos, por ejemplo SQL o MongoDB, para crear el primer pase de proyección de datos. Una vez que los datos ingresan a la herramienta, se pueden transformar aún más usando variables y grupos, y cada campo puede usar lógica personalizada para crear la transformación o proyección de datos deseada.


Descargas: Community Edition

TIBCO Visual Analytics

SOFT: Tableau 6.0, bases de datos y visualización

Gracias por visitar el sitio de Juantxo Cruz

Tableau 6.0
Bases de datos y visualización.

Desktop Personal Edition
999$
Tableau Desktop is a software application based on a technology breakthrough from Stanford University. It lets you graphically analyze virtually any structured data to produce beautiful charts, graphs, dashboards and reports in minutes. With Tableau’s easy to use drag-n-drop interface you’ll be quickly customizing views, layouts, shapes, colors and more to help you present your data insights.

Tableau Server is a software application that makes sharing live, interactive data visualizations, dashboards, reports and workbooks from Tableau Desktop fast and easy. With enterprise-class security and performance to support large deployments. And Tableau’s in-memory Data Engine lets you make data blazing fast on your local machine and manage the load on your mission-critical databases and cubes.

Gracias por visitar el sitio de Juantxo Cruz

Desktop Professional Edition
1.999$

leaders in fast analytics + visualization
It started with a goal to help people see and understand their data anywhere: spreadsheets, data marts, web files, databases, data warehouses. At Stanford, a small team led by Chris Stolte and advised by Prof. Pat Hanrahan became Tableau’s basis.
Results so far? 50,000+ people worldwide using desktop and web-based business intelligence software to produce visual analytic results like never before..

Why you’ll love Tableau ServerFast web analytics. Put live interactive analytics on the web in seconds.
Data scalability. No limit on the size of data you can work with. Work in-memory to take load off critical infrastructure or connect live to leverage fast databases.
Replace or give life to your BI platform. Replace your BI Platform completely, or run Tableau in parallel with your current system.
Easy data blending. Users can easily blend data from two databases or a database and Excel sheet without needing pre-integration work or a separate database. Free training. Live or On-Demand training online.

GRAPHICS: eXplorer Statistics, NCVA, Suecia

Gracias por visitar el sitio de Juantxo Cruz

eXplorer Statistics
National Center for Visual Analytics (NCVA)
Suecia
Programación y análisis de la estadística.
«GeoAnalytics Visualization»
Introducción.

Gracias por visitar el sitio de Juantxo Cruz

Usuarios:
The WorlBank
The Economist
The BBC
Eurostat
OCDE
Statistic Denmark
City of Göteborg
Ericsson
Unilever
Gracias por visitar el sitio de Juantxo Cruz

National Center for Visual Analytics (NCVA) is a Swedish national resource funded through the Swedish Knowledge Foundation’s (KK-Stiftelsen) Visualization Program including VINNOVA, SSF, ISA and Vårdalstiftelsen and our industrial and government research partners. NCVA will help to spread geovisual and visual analytics technology into industry and government agencies.
NCVA is managed by Professor Mikael Jern VITA/ITN
Gracias por visitar el sitio de Juantxo Cruz

Strategies
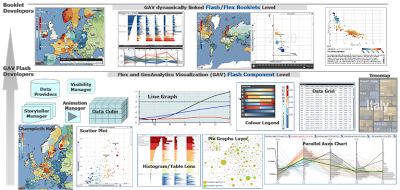
Programming each new Visual Analytics application from scratch is a complex and expensive task and a very inefficient way to work. A high-level toolkit, comprising many well-tested and compatible components, will make this process far less time-consuming and help ensure the correct functioning of each new application produced. To achieve this we build upon our «GeoAnalytics Visualization» framework, GAV, to provide a generic visualization framework for a diverse range of application areas and fully integrated with web tools such as Flash/Flex (GAV Flash) or optimized for performance with Microsoft DirectX (GAV). This framework is designed to provide integrated views of large information spaces, coordinated viewing of information in context, and to approach complex information through the use the overview and detail paradigm. These are the principles behind the VA concept which have made it such a powerful idea in the scientific community. NCVA will show the effectiveness of the technology and provide results in four distinct forms:

1.Valuable applications, addressing key concerns for our partners in industry, public services and academia.
2.New or enhanced methods within GAV framework developed for these purposes but which will then be available to users in other potential areas of interest.
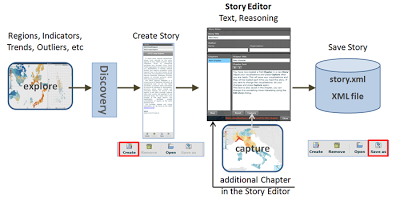
3.Novel techniques to facilitate the recording, review and dissemination of the reasoning within the VA process allowing the analyst to use interactive ‘story-telling’ to convey how conclusions are reached, improving the credibility of the results obtained.
4.New results from evaluation of these applications and techniques in the workplace context, feeding back into new and improved developments in a continuous cycle.
Applied research will be carried out in the context of a number of applications, drawn from diverse areas associated with the activities of the industrial partners, showing the generality of the underlying framework. Each of these applications can also be seen as a demonstrator of the technology. In this work, we will follow a ‘science-to-solutions’ approach to address the entire research, development and deployment process. The strong engagement by industry and public service partners that depend on state-of-the-art VA tools will guarantee that users will be involved from the start and will participate in the definition of the applied research agenda. The partners will, in turn, gain access to front line research, prototypes and components for integrating new and innovative VA tools.

Gracias por visitar el sitio de Juantxo Cruz

Postal addresses

Linköping
All units but the Faculty of Health Sciences
Linköping University
SE-581 83 LINKÖPING
Sweden

Tel: +46 13 28 10 00
Fax: +46 13 14 94 03
e-mail: liu@liu.se
Please notice that questions regarding study programmes, admission, application procedures, enrolment etc, should be sent to studyinfo@liu.se

Faculty of Health Sciences
Hälsouniversitetet
Universitetssjukhuset
SE-581 85 LINKÖPING

Tel: +46 13 22 20 00

Norrköping
All units
Linköping University
Campus Norrkšping
SE-601 74 NORRKÖPING

Tel switchboard: +46 11 36 30 00
Fax: +46 11 26 58 50

Economist: http://www.economist.com/britain-in-context/
OECD: http://www.oecd.org/innovation/strategy/charting
Statistics Denmark: http://www.dst.dk/OmDS/BagTal/Arkiv/2010-05-06-Motorcykler.aspx
OECD: http://vitagate.itn.liu.se/GAV/development/testVislet/
SCB and Eurostat: http://swedeneurostat.blogspot.com/2010/03/education-in-eu-example-with-vislets.html#links
Goteborg City: http://www.samhallsutvecklingen.se/413/stora-inkomstskillnader-i-goteborg/
OECD eXplorer: http://www.ncomva.com/?p=125 (NComVA Vislet demo with OECD eXplorer ageing population in EU 1990-2008).
OECD Factbook: http://www.ncomva.com/?page_id=111 (NComVA Vislet Demo with OECD Factbook – fertility versus women employment rate for 1970-2006)
OECD Regional development: http://www.oecd.org/gov/regional/statisticsindicators
World eXplorer: http://www.ncomva.com/?page_id=297/

GRAPHICS: El pulso de la nación, Twitter, CCIS

Gracias por visitar el sitio de Juantxo Cruz

© 2010 Alan Mislove, Sune Lehmann, Yong-Yeol Ahn, Jukka-Pekka Onnela, J. Niels Rosenquist. Some rights reserved. Images, poster, and movie are shared under the Creative Commons Attribution 3.0 License.

Visualización: El pulso de la nación estadounidense.
Alan Mislove
Harvard University
Northeastern University of Boston. College of Computer and Information Science.
Cartograma: mapa en el que se refleja una variable. En este caso, el número de ‘tweets’.
Software de Mark E. J. Newman.
Se analizaron 300 millones de comentarios en Twitter y se trasladaron al mapa por franjas horarias.
De 12.00h a 16.00h, no están para bromas.

Equipo:
Alan Mislove, College of Computer and Information Science, Northeastern University
Sune Lehmann, Center for Complex Network Research, Northeastern University
Yong-Yeol Ahn, Center for Complex Network Research, Northeastern University
Jukka-Pekka Onnela, Harvard Medical School, Harvard University
J. Niels Rosenquist, Harvard Medical School, Harvard University

Gracias por visitar el sitio de Juantxo Cruz

Libro: Atlas of The Real World.
Hardcover: 416 pages
Publisher: Thames & Hudson (October 27, 2008)
Language: English
ISBN-10: 0500514259
ISBN-13: 978-0500514252

WWW: HTML5 vs ACTIONSCRIPT

Gracias por visitar el sitio de Juantxo Cruz

Apple vs Adobe.

Ipad+Iphone contra tecnología FLASH.

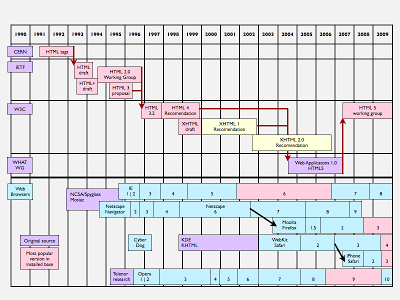
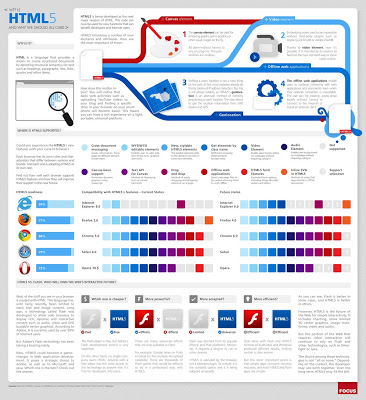
HTML5 vs Action Script.

Steve Jobs contra Shantanu Narayen.

Un alto porcentaje de las aplicaciones actuales están desarrolladas en Flash (el 75% del vídeo online, por ejemplo). No funcionan con Apple.

La páginas digitales en Flash no suman páginas vistas.

Guerra en el mercado del vídeo que afecta a infografía, diseño y multimedia.

HTML5 todavía es un lenguaje por desarrollar, acaba de nacer. Inmaduro y con muchos años por delante de evolución.

Sport Illustrated tenía media revista en Flash. Acaba de hacer público su desarrollo en HTML5. Cientos de estudios multimedia trabajan a contrarreloj convirtiendo las publicaciones de desarrollo.

HULU (vídeo) también se pasa al HTML5.

Flash representa un 5% de los ingresos de Adobe. Su negocio está en la venta de software (Photoshop, Illustrator…).

Guerra sin cuartel.

WE LOVE APPLE, pero también Flash.

VIDEO: Adobe Flash, en la TV digital

Gracias por visitar el sitio de Juantxo Cruz

Adobe Flash mete su garra en el monitor de la televisión.
Originalmente, el programa se desarrolló para la web, ahora da un paso hacia la televsión: Adobe Strobe.

La compañía anunciará hoy en la National Association of Broadcasters Show (Las Vegas) que a finales de 2009 las televisiones digitales podrán ejecutar los trabajos realizados con Flash.

Atlantic Records, Broadcom, Comcast, Disney, Intel, Netflix, STMicroelectronics, The New York Times Company, NXP Semiconductors o Sigma Designs darán cobertura a los esfuerzos de Adobe.

!Gracias por visitar mi sitio! | Copyright © 1992- 2025 juantxo_cruz. Todos los derechos reservados.