Herramientas para la visualización de la información sobre mapas

Herramientas de geoposicionamiento de información

Algunas referencias sobre programas y recursos para trasladar una base de datos o un fichero a un entorno espacial, generalmente mapas digitalizados.
(en construcción)

Kepler, análisis geoespacial.

KEPLER
Kepler.gl es una poderosa herramienta de análisis geoespacial de código abierto para conjuntos de datos a gran escala.

Es una aplicación basada en web de alto rendimiento y agnóstica de datos para la exploración visual de conjuntos de datos de geolocalización a gran escala. Construido en la parte superior de deck.gl, kepler.gl puede representar millones de puntos que representan miles de viajes y realizar agregaciones espaciales sobre la marcha.

Kepler.gl usa el reductor ‘redux’ para almacenar y administrar las transiciones de estado. Este paquete consta de un reductor y los componentes de la interfaz de usuario para ‘renderizar’ y personalizar el mapa.

Ir a la introducción en github.

CartoDB, geolocalización de datos.

CARTODB
Geolocalización de grandes volúmenes de datos y combinación con visualizaciones. Integración con lenguajes de programación en D3js. Es una plataforma en plena expansión sobre google maps y está siendo incorporado por múltiples empresas para tomas de decisiones:
Quién lo utiliza: BBVA, Wall Street Journal, United Nations, Twitter, Mashable

MapBox, búsqueda de mapas, navegación y localización.

MAPBOX
Proveedor de mapas online.
Mapbox es el creador, o un colaborador significativo, de algunas bibliotecas de mapeo de código abierto y aplicaciones, entre ellas la especificación MBTiles, la cartografía TileMill IDE, la biblioteca de Javascript de Leftlet, y el estilo de mapas y analizador sintáctico (parser) CartoCSS.

Quién lo utiliza: New York Times, NPR, ProPublica o el Washington Post, Foursquare, Evernote, Financial Times, The Weather Channel, Uber Tecnologies.

OpenStreetMap, mapas de código abierto.

OPEN STREET MAP
OpenStreetMap (también conocido como OSM) es un proyecto colaborativo para crear mapas libres y editables. OpenStreetMap está creado por una gran comunidad de colaboradores que con sus contribuciones al mapa añaden y mantienen datos sobre caminos, senderos, cafeterías, estaciones de ferrocarril y muchas cosas más a lo largo de todo el mundo.

OpenStreetMap impulsa mediante geodatos a miles de sitios web, aplicaciones móviles y dispositivos de hardware.

Google Maps y su API de Javascript.

GOOGLE MAPS
Herramienta para posicionar información, en formato GeoJSON O JSON, sobre capas en un mapa.
Usando la API de Javascript de Google Maps, se pueden insertar en un mapa marcadores, polilíneas, polígonos, etc.

MAPS: GlobCover, ESA

El nuevo mapa de la Agencia Espacial Europea.

Gracias por visitar el sitio de Juantxo Cruz

21 December 2010
ESA’s 2009 global land cover map has been released and is now available to the public online from the ‘GlobCover’ website. GlobCover 2009 proves the sharpest possible global land cover map can be created within a year.

The map was produced using 12 months of data from Envisat’s Medium Resolution Imaging Spectrometer at a resolution of 300 m.
ESA and Belgium’s Université catholique de Louvain created the map using software developed by Medias France and Germany’s Brockmann Consult on data collected from 1 January to 31 December 2009. GlobCover 2009 was generated within a year of acquiring the final satellite data.

The map’s legend uses the UN Food and Agriculture Organisation’s Land Cover Classification System.

Some 8000 people have downloaded the previous version, GlobCover 2005. These maps are useful for studying the effects of climate change, conserving biodiversity and managing natural resources.

Credits: ESA 2010 and Université Catholique de Louvain

GRAPHICS: Estudios de la nube de ceniza

17 de abril de 2010, NASA

Gracias por visitar el sitio de Juantxo Cruz

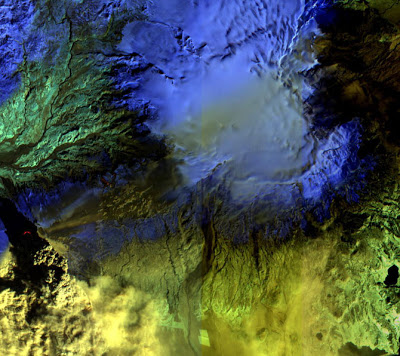
False-color infrared image of Iceland’s Eyjafjallajökull volcano acquired Sat., April 17, 2010, by the Advanced Land Imager (ALI) instrument onboard NASA’s Earth Observing-1 (EO-1) spacecraft. Strong thermal emissions, shown in red, are visible at the base of the ash plume and above and to the right from earlier lava flows located at Fimmvorduhals. Image credit: NASA/JPL/EO-1 Mission/GSFC/Ashley Davies

Gracias por visitar el sitio de Juantxo Cruz

19 de abril, espectómetro
The Multi-angle Imaging SpectroRadiometer (MISR) instrument on NASA’s Terra satellite captured these different views of the ash plume from Iceland’s erupting Eyjafjallajökull volcano on April 19, 2010, which provide information on the amount and type of particles in the plume itself. Left: a true-color nadir (vertical) view; left-center: a map of retrieved aerosol optical depth, a measure of the amount of particulate matter in the atmosphere; right-center: the Angstrom exponent, which is related to average particle size; right: particle shape. Image credit: NASA/GSFC/LaRC/JPL, MISR Team

Gracias por visitar el sitio de Juantxo Cruz

A computer-analyzed map of ash plume heights, corrected to compensate for the effects of wind. Reds are highest, blue lowest. Image credit: NASA/GSFC/LaRC/JPL, MISR Team

Gracias por visitar el sitio de Juantxo Cruz

Photo-like satellite images give us a view of the world that is relatively familiar to us; the images look a lot like a digital photo. But for many scientific studies, a photo-like image doesn’t provide enough information. For example, to predict where the ash from an eruption may spread or how it might interact with clouds, scientists need a mathematical way to describe the concentration of particles in the air.

Gracias por visitar el sitio de Juantxo Cruz

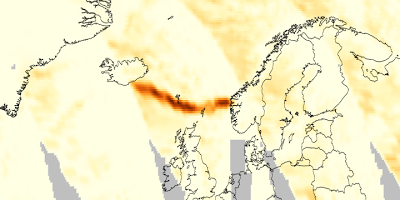
Cloud-Aerosol Lidar and Infrared Pathfinder Satellite Observations (CALIPSO) satellite watches Eyjafjallajökull’s plume drift over northern Europe. Credit: NASA/Kurt Severance and Tim Marvel

GERMAN AEROSPACE CENTER
Resultados del estudio realizado con un Falcon 20E para observar el impacto de las cenizas en el aparato.
Realizado el 19 de abril, publicado el 20.

La prueba fue satisfactoria, en Alemania.
No se apreciaron daños.

Gracias por visitar el sitio de Juantxo Cruz

On 19 April 2010 the DLR ‘Falcon 20E’ research aircraft took off from Oberpfaffenhofen at 16:00 CEST to examine the ash cloud from the Icelandic volcano Eyafjallajoküll. The route for this measurement flight led from Oberpfaffenhofen to Leipzig, then over Hamburg and on to Bilthoven (the Netherlands) and returned via Stuttgart to Oberpfaffenhofen.

Gracias por visitar el sitio de Juantxo Cruz

Figure 1: Flight route of the DLR Falcon on 19 April 2010

Gracias por visitar el sitio de Juantxo Cruz

Figure 2: FLEXPART simulations of the time evolution of an aerosol tracer released from the Iceland volcano (release rate inferred from MSG observations) since 14 April 2010. Total columns (pmol/mol) on 16 April, 15 UTC (a), 17 April, 15 UTC (b), 18 April, 15 UTC, and 19 April, 17 UTC (conditions during the Falcon flight).

Gracias por visitar el sitio de Juantxo Cruz

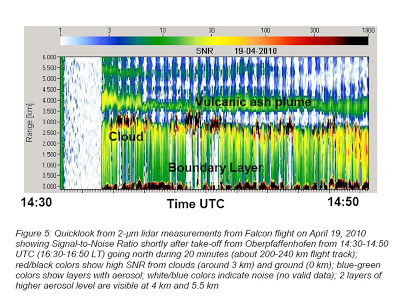
Figure 5: Quicklook from 2-μm lidar measurements from Falcon flight on April 19, 2010 showing Signal-to-Noise Ratio shortly after take-off from Oberpfaffenhofen from 14:30-14:50 UTC (16:30-16:50 LT) going north during 20 minutes (about 200-240 km flight track); red/black colors show high SNR from clouds (around 3 km) and ground (0 km); blue-green colors show layers with aerosol; white/blue colors indicate noise (no valid data); 2 layers of higher aerosol level are visible at 4 km and 5.5 km

PHOTO GEMS: 1946, primera foto desde el espacio

Gracias por visitar el sitio de Juantxo Cruz

PRIMERA FOTOGRAFÍA desde el espacio.
24 de octubre de 1946

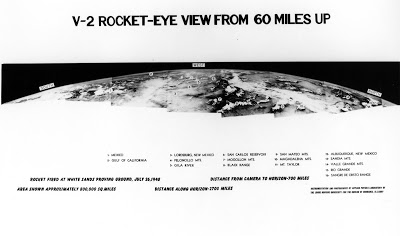
On October 24, 1946, not long after the end of World War II and years before the Sputnik satellite opened the space age, a group of soldiers and scientists in the New Mexico desert saw something new and wonderful—the first pictures of Earth as seen from space.
The grainy, black-and-white photos were taken from an altitude of 65 miles by a 35-millimeter motion picture camera riding on a V-2 missile launched from the White Sands Missile Range. Snapping a new frame every second and a half, the rocket-borne camera climbed straight up, then fell back to Earth minutes later, slamming into the ground at 500 feet per second. The camera itself was smashed, but the film, protected in a steel cassette, was unharme.

Gracias por visitar el sitio de Juantxo Cruz

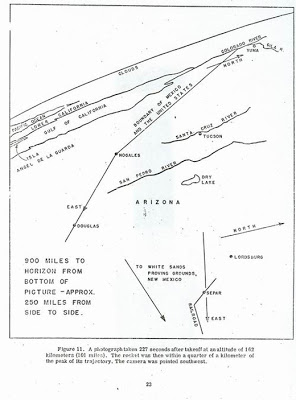
Esquema de lo que se ve.

Gracias por visitar el sitio de Juantxo Cruz

V-2

Gracias por visitar el sitio de Juantxo Cruz

Vista de 1947, V-2

Gracias por visitar el sitio de Juantxo Cruz

Composición, julio de 1948

Gracias por visitar el sitio de Juantxo Cruz

TIROS-1, 50 años (NASA)
1 de abril de 1960

Gracias por visitar el sitio de Juantxo Cruz

La primera imagen desde Tiros, 1960

PHOTO: Haití, terremoto y puerto, NASA

Gracias por visitar el sitio de Juantxo Cruz

Haiti: 7.0 Quake Near Port Au Prince (as of 21 Jan 2010)

Imágenes NASA terremto

The Advanced Spaceborne Thermal Emission and Reflection Radiometer (ASTER) instrument on NASA’s Terra spacecraft captured this false color image of Haiti, on January 21, 2010, nine days after a magnitude 7.0 earthquake struck the region and caused massive damage and loss of life, and one day after a large 5.9 aftershock caused additional damage. While ASTER’s 15-meter (50-foot) resolution is not sufficient to see damaged buildings, it can be used to identify other results of the shaking. Tiny dots of white against the plant-covered landscape (red in this image) are possible landslides, a common occurrence in mountainous terrain after large earthquakes. The possible landslides were identified by carefully comparing the new image with an image acquired one year previously.

Port-au-Prince, Haiti’s capital, is silver in the false color image. The rivers are pale blue, while the ocean is dark blue. Exposed soil is white.

NASA Earth Observatory image created by Jesse Allen, using data provided courtesy of NASA/GSFC/METI/ERSDAC/JAROS, and U.S./Japan ASTER Science Team. Caption adapted from the Jet Propulsion Laboratory Photojournal.

Instrument:

Terra – ASTER

Gracias por visitar el sitio de Juantxo Cruz

Los barcos en Puerto Príncipe

Imágenes NASA terremto

Ships carrying relief supplies and aid stream into Port-au-Prince, Haiti, in this image taken by the Advanced Spaceborne Thermal Emission and Reflection Radiometer (ASTER) on NASA’s Terra satellite on January 21, 2010. The city’s port was badly damaged in the massive 7.0 earthquake that hit the island on January 12. On January 20, one pier re-opened, allowing ships to dock for the first time since the earthquake, said news reports.

The newly reopened pier is the city’s south pier, the narrow strip that juts out into the water in this image. Part of the pier collapsed in the earthquake, but the remaining structure is just stable enough to support a single truck offloading supplies from docked ships, reported CNN.

Tiny streaks of white in the dark blue water are ships. The largest ship in the scene may be the USNS Comfort, a 273-meter (894-foot) long U.S. Navy hospital ship that was taking patients by helicopter until a pier could open up, according to Business Week.

Though its capacity is limited, the fragile pier should speed the distribution of food and other supplies to earthquake victims. Prior to January 20, aid had been coming into Port-au-Prince on airplanes arriving on a single runway, said news reports. The ships have a much greater capacity.

Port-au-Prince itself is blue gray in this false color image. At this scale, the only visible earthquake damage is the shortened pier, but the image does reveal how densely constructed the city was. Plant-covered land is red. Little open, plant-covered ground can be seen in the heart of the city.

1. References

2. CNN. (2010, January 21). Haiti pier opens, road laid into Port-au-Prince. Accessed January 21, 2010.

3. Dolmetsch, C, and Varner, B. (2010, January 21). U.S.-rescued Haitian Victims Treated on Hospital Ship. Business Week. Accessed January 21, 2010.

4. Leonard, T. (2010, January 20). Haiti earthquake: damaged port reopens to aid ships. Telegraph. Accessed January 21, 2010.

5. Military Seacraft Command. USNS Comfort. Accessed January 21, 2010.

NASA Earth Observatory image created by Jesse Allen, using data provided courtesy of NASA/GSFC/METI/ERSDAC/JAROS, and U.S./Japan ASTER Science Team. Caption by Holli Riebeek.

Instrument:

Terra – ASTER

GRAPHICS: Agua en la estadística

Gracias por visitar el sitio de Juantxo Cruz

Fotografía puesta en circulación ayer por Jonas Dino, NASA.
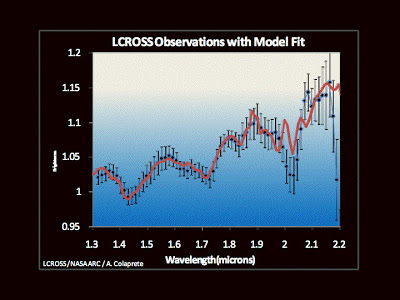
El impacto de LCROSS (Lunar CRater Observation and Sensing Satellite) el pasado 9 de octubre proporcionó información que indicaría que hay agua cerca del polo sur.

Gracias por visitar el sitio de Juantxo Cruz

La realidad es que en las fotos no se ve nada. Podría ser cualquier cosa.

Gracias por visitar el sitio de Juantxo Cruz

Gracias por visitar el sitio de Juantxo Cruz

Gracias por visitar el sitio de Juantxo Cruz

Gracias por visitar el sitio de Juantxo Cruz

Gráficas realizadas con la información optenida trás la colisión de la sonda lunar LCROSS con el satélite.

Gracias por visitar el sitio de Juantxo Cruz

Espectrónomos en el interior de la sonda lunar.

Los espectrónomos de la sonda proporcionaron datos que hacen pensar que hay agua. En teoría, los investigadores analizaron estas gráficas y es ahí donde vieron el agua, en la estadística.
Complicado.

Fotografías:
NASA

!Gracias por visitar mi sitio! | Copyright © 1992- 2025 juantxo_cruz. Todos los derechos reservados.