Visualización de la noticia: Gráficos, Fleet Street y la carrera por la suscripción

Capítulo 2: Reino Unido
Gráficos, Fleet Street y la carrera por la suscripción

En el siglo XX, Fleet Street y el área próximo estaban dominadas por la prensa nacional y sus rotativas. Poco queda de la mítica calle que fue hogar del The Times y The Sun. En otros tiempos el periodista buscaba la exclusiva en la calle o mediante la búsqueda de fuentes en un artículo de investigación. En el siglo XXI, las nuevas tecnologías, internet y las redes han puesto sobre la mesa un nuevo modelo de periodista que consume parte de su tiempo delante del monitor, buceando en series de datos en busca de una historia.

Las compañías generadoras de contenidos buscan el talento innovador y el espíritu creativo de sus profesionales para mantenerse en la vanguardia de la industria. Por ello, ya no sólo son necesarios los periodistas, también buscan especialistas en marketing, analistas, diseñadores, ingenieros y nuevos roles que están todavía por definir. Los estudios estadísticos y los gráficos son ahora visibles por suscripción. Se acabaron los gráficos interactivos gratuitos o compartidos en las redes sociales. Son un producto muy valorado por los lectores.

Características de los profesionales

– Alfabetización visual: Prueba clara de alfabetización visual y la capacidad de entregar datos de manera comprensible y convincente. Profundo conocimiento de la teoría detrás de la visualización de datos y el periodismo de datos.

– Capacidad de análisis: Uso de herramientas de análisis de datos, técnicas de obtención de datos y desarrollos interactivos para profundizar en los datos y contar una historia.

– Visualización de datos: Experiencia en el uso de software de visualización para crear contenidos.

– Interactividad: Conocimiento especializado de la experiencia interactiva del usuario con gráficos, cartografías, visualizaciones de datos.

– Multiplataforma: Experiencia trabajando en un entorno de noticias ocupado en múltiples plataformas.

A continuación listamos algunos medios interesantes para conocer mejor el mundo de la visualización informativa en el Reino Unido. Son marcas globales con sedes en las principales capitales mundiales.
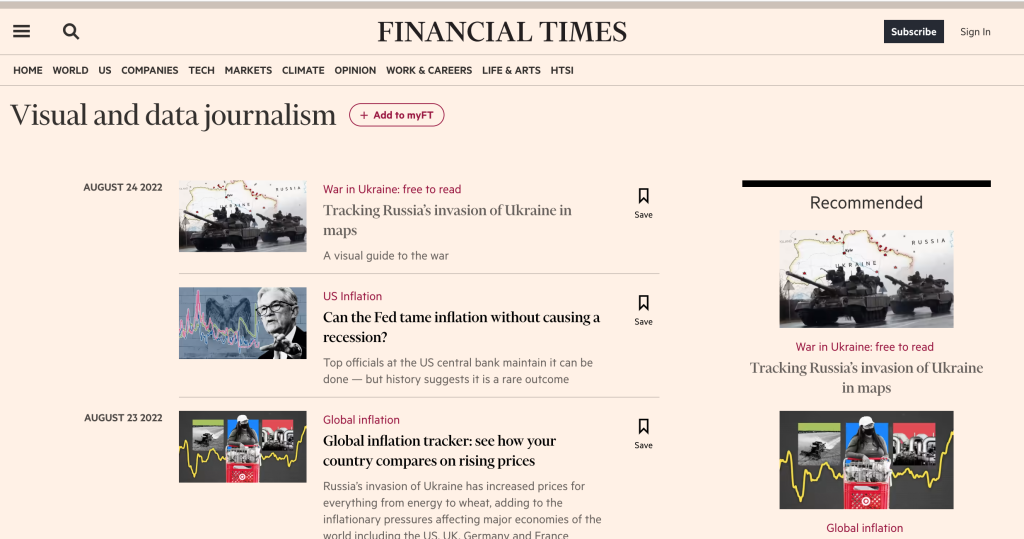
Financial Times, profeta de la información económica.

1. Financial Times, The Financial Times Ltd
Londres, Reino Unido
Con más de 125 años como una de las organizaciones de información y noticias líderes en el mundo. Publica sus propios índices bursátiles con los valores que cotizan en Londres (FTSE, FTSE 250). El diario de las finanzas global tiene una especial sensibilidad por la periodismo de datos, la visualización y la creación de un vocabulario visual compartido con la redacción.

Acceso por subscripción digital: 39 euros al mes (345 euros/año).
Subscripción digital + print : 966 euros/año

Referencias: Alan Smith Obe, John Burn-Murdoch

Links de interés

Visual and data journalism
Data visualization

The Chart Doctor (Visual Vocabulary)
Designing with data
FT Data en Twitter
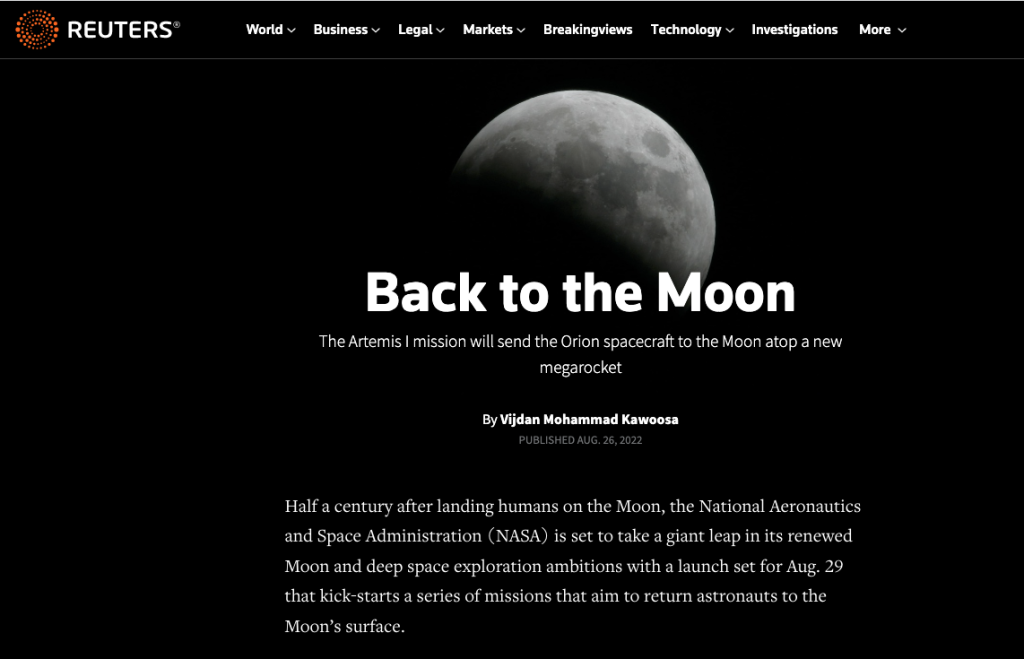
Reuters, noticias globales

2. Reuters News Graphics Service, Thomson Reuters
Londres, Reino Unido | Nueva York, EEUU
Reuters es una agencia de noticias global de información, fundada en Londres hace más de 165 años, con sedes principales en Londres, Nueva York y Singapur. El equipo de gráficos (Reuters News Graphics Service) tiene oficinas en estas sedes. Hay alrededor de 20 miembros en todo el equipo. Cada unidad tiende a centrarse principalmente en su región (dividida en AMERS, EMEA y APAC).

Referencias: Matthew WeberSimon Scarr, Daisy Chung, Vijdan Mohammad Kawoosa

Links de interés

Ver gráficos

Sitio Web

En Twitter
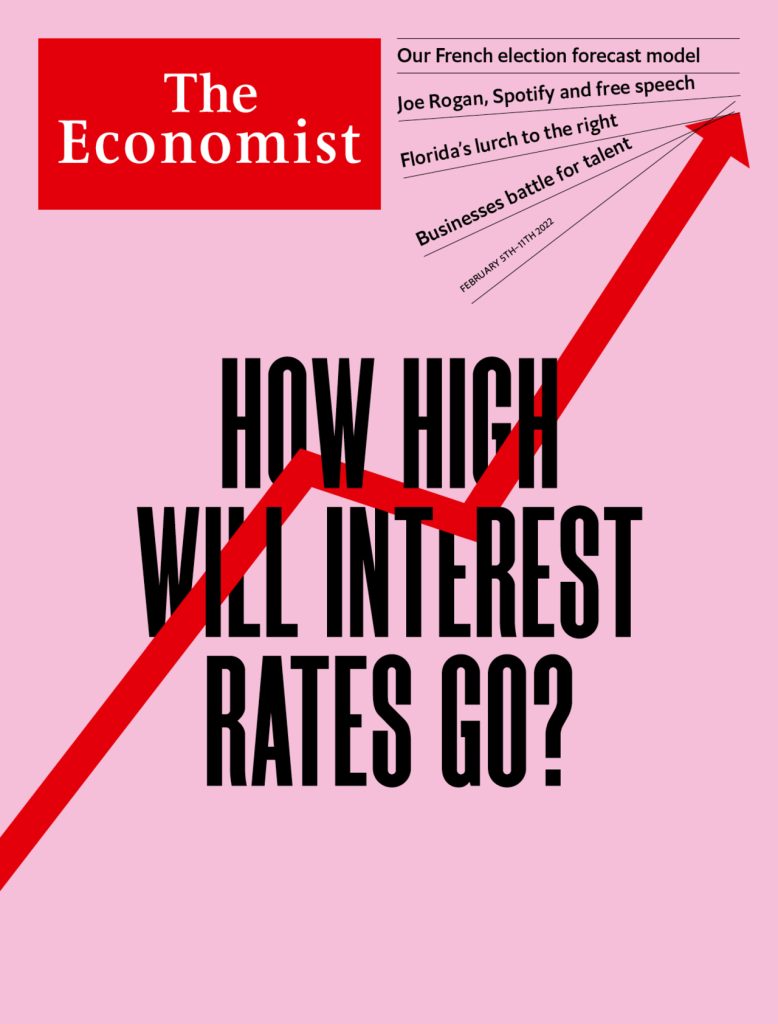
The Economist, portadas para presentar un modelo socioeconómico.

3. The Economist, The Economist Group
Londres, Reino Unido
La revista semanal de relaciones internacionales, finanzas, ciencia y tecnología ha presentado gráficos y mapas en sus páginas desde hace más de 150 años. Sus gráficos se centran en la estadística política y económica, destacando por su elegancia, limpieza y buen uso del color.

Subscripción digital: 289 euros/año

Referencias: Phil Kenny, Graham Douglas,  Helen Atkinson, Adam Meara, Sarah Leo, Martín González, Alex Selby-Boothroyd

Links de interés

La sección The Graphic Detail fue creada en 2018 para potenciar el periodismo de datos.
The Economist y la visualización de datos
The Economist Data Team en Twitter

The BBC
The BBC: radio, TV, internet.

4. The British Broadcasting Corporation (BBC)
Londres, Reino Unido
El canal de noticias público creado en 1932. Hace unos años (2014-15) producían gráficos interactivos con Adobe Flash y librerías de Javascript como D3. En la actualidad realizan piezas de información estadística con librerías de R, como ggplot2, infografías estáticas y animaciones para TV.
https://www.bbc.co.uk/news/11628973
Referencias: Chris Ashton

Links de interés

BBC News Graphics en Twitter (sin mantenimiento desde 2020)
BBC Visual and Data Journalism Cookbook
News Interactives and Graphics
The Guardian, marca global

5. The Guardian, The Guardian Media Group (Scott Trust)
Londres, Reino Unido
El diario liberal tiene una edición en el Reino Unido y dos sitios web internacionales, Guardian Australia (2013) y Guardian US (2011).The Guardian lanzó su Datablog en 2009, el sitio web de referencia de la estadística y los datos periodísticos.
Subscripción digital: 282 euros/año

Referencias: Simon Rogers, Cath Levett, Mariana Santos, Alvin Chang, Caelainn Barr, Mona Chalabi, Nick Evershed

Links de interés

The Guardian Data Visualization
The Guardian Graphics

The Guardian Data
The Guardian Visuals en Twitter

Herramientas para la visualización de la información sobre mapas

Herramientas de geoposicionamiento de información

Algunas referencias sobre programas y recursos para trasladar una base de datos o un fichero a un entorno espacial, generalmente mapas digitalizados.
(en construcción)

Kepler, análisis geoespacial.

KEPLER
Kepler.gl es una poderosa herramienta de análisis geoespacial de código abierto para conjuntos de datos a gran escala.

Es una aplicación basada en web de alto rendimiento y agnóstica de datos para la exploración visual de conjuntos de datos de geolocalización a gran escala. Construido en la parte superior de deck.gl, kepler.gl puede representar millones de puntos que representan miles de viajes y realizar agregaciones espaciales sobre la marcha.

Kepler.gl usa el reductor ‘redux’ para almacenar y administrar las transiciones de estado. Este paquete consta de un reductor y los componentes de la interfaz de usuario para ‘renderizar’ y personalizar el mapa.

Ir a la introducción en github.

CartoDB, geolocalización de datos.

CARTODB
Geolocalización de grandes volúmenes de datos y combinación con visualizaciones. Integración con lenguajes de programación en D3js. Es una plataforma en plena expansión sobre google maps y está siendo incorporado por múltiples empresas para tomas de decisiones:
Quién lo utiliza: BBVA, Wall Street Journal, United Nations, Twitter, Mashable

MapBox, búsqueda de mapas, navegación y localización.

MAPBOX
Proveedor de mapas online.
Mapbox es el creador, o un colaborador significativo, de algunas bibliotecas de mapeo de código abierto y aplicaciones, entre ellas la especificación MBTiles, la cartografía TileMill IDE, la biblioteca de Javascript de Leftlet, y el estilo de mapas y analizador sintáctico (parser) CartoCSS.

Quién lo utiliza: New York Times, NPR, ProPublica o el Washington Post, Foursquare, Evernote, Financial Times, The Weather Channel, Uber Tecnologies.

OpenStreetMap, mapas de código abierto.

OPEN STREET MAP
OpenStreetMap (también conocido como OSM) es un proyecto colaborativo para crear mapas libres y editables. OpenStreetMap está creado por una gran comunidad de colaboradores que con sus contribuciones al mapa añaden y mantienen datos sobre caminos, senderos, cafeterías, estaciones de ferrocarril y muchas cosas más a lo largo de todo el mundo.

OpenStreetMap impulsa mediante geodatos a miles de sitios web, aplicaciones móviles y dispositivos de hardware.

Google Maps y su API de Javascript.

GOOGLE MAPS
Herramienta para posicionar información, en formato GeoJSON O JSON, sobre capas en un mapa.
Usando la API de Javascript de Google Maps, se pueden insertar en un mapa marcadores, polilíneas, polígonos, etc.

Jurado 2017 INMA Global Media Awards

2017 INMA Media Awards

Jurado en la edición de 2017 INMA Global Media Awards, en la categoría ‘Mejor uso del móvil’ (Best Use of Mobile’).

Contest Coordinator: Raquel Meikle

Aquí los trabajos ganadores.


Raquel Meikle, INMA Global Media Awards


About INMA

The International News Media Association (INMA) is a global community of market-leading news media companies reinventing how they engage audiences and grow revenue in a multi-media environment. The INMA community consists of 8,000 executives at 600+ media companies in 80+ countries. Headquartered in Dallas, INMA has offices in Antwerp, New Delhi and San Salvador.


Judging Guidelines

INMA Global Media Awards 2017

A. OVERVIEW

As a judge in INMA Global Media Awards competition, you will see the world’s best marketing material produced by news media companies during the past year.

Media company executives submitted their entries via the internet to an online Entry Management System. You will judge pre-determined categories within this database. Please be aware that databases have their own set of rules (and this one is no different).

The judging deadline is Sunday, February 26.


B. REQUIREMENTS

To judge the INMA Global Media Awards, you need a good pair of eyes, a fresh mind, a little patience … and a few key technical requirements. These include:

• A fast connection to the Internet.

• 4-8 hours, which can be broken up and completed at your leisure.

• The latest versions of QuickTime, Windows Media Player, and Adobe

• Basic tools such as a web browser and the capability to view the following file types:

o PDF (images)

o JPEG (images)

o MP3

If you do not have these capabilities on your computer, please advise INMA. There is no other way to view the creative submissions. These formats are standard on most computers.

C. JUDGING OBJECTIVES

Judging is simple. First, log into the system using your login and password provided to you by e-mail.

Second, select your category from the drop down menu provided, which will then take you to the list of entries for that specific category and entry groups. Please note you must judge entries for both entry groups (Group 1 and Group 2) within your assigned category.


On the judging page, we ask you to take four actions:

1. Read the objectives and results.

2. View each creative campaign entered.

3. Score each entry.

4. Comment on each entry that you believe may merit award consideration.

You are being asked to score – on a scale of 1 to 50 – the overall quality of the concept, creativity, graphic design, production, and results of each marketing campaign.

Generally, scores are based on the following:

• 1-10 Fail

• 11-20 Poor

• 21-30 Average

• 31-40 Good

• 41-50 Great

You will score each entry along with at least two other judges. The entry with the highest score will be awarded first place, and the second- and third-highest scores will be awarded second- and third-place certificates.

D. JUDGING TIPS

To reiterate, you are judging within a Web-based database. This database is like all others with its own “unique” set of properties. Here are some helpful hints:

1. Can I change my scores and comments? Please be aware that you may go back and re-score or change your comments in any “scored” entry. “Scored” entries reside in the section labeled

“Entries you have judged.”

2. Can I jump among entry groups? Yes. You will be asked to judge two groups within a category – one for Local/Regional brands and one for National/Global brands. You may start with any group listed, but we recommend once you start judging a group you finish before moving to the next group. This will allow you to judge like-sized companies against similarly focused companies.

3. Can I take a break? You may stop judging at any time by logging out of the system. Please keep in mind the system will automatically time you out if there is no activity after an extensive amount of time. In both scenarios, simply return to the login page and type in your login and password. So long as you have hit the “Save Score” button, your entries will be saved for the next time you choose to judge. You have the option to judge in one sitting, or you may judge as many times as you like between February 12 and February 26. Please allow 4-8 hours to complete the judging process. Please don’t wait until the last minute to judge!

4. How do I navigate the database? There are only two pages for judging. Please click on the icons provided at the top of each page to navigate within the system.

5. When am I done? When you have completed all entry groups, you will either be prompted to judge your next pre-assigned category or go to the Conclusion page.

6. How do I judge a non-English entry? If the campaign objectives and results were not provided in English, INMA has endeavoured to translate them. It was strongly suggested in the Call For Entries that the judging would be conducted in English and providing a translation would assistjudges. If you have language-related questions beyond what is provided, please contact Raquel at awards@inma.org.

E. JUDGING CRITERIA

Entries are judged on the basis of concept, creativity, graphic design, production, and results:

1. Concept: Generally related to the objective of campaign. Was the idea compatible with the short- and long-term marketing goals? How does the idea rate with regard to peer entries, available resources, and the market situation?

2. Creativity: Given that an idea/concept can be expressed in many ways, does the campaign have creative impact? Does it work to stand out from other marketing? Does it compel the reader/audience to read/watch? Extra consideration should be given to creative problemsolving, not simply creative implementation.

3. Graphic design: Still related to the campaign’s objective and execution, are the graphics appealing and compelling to the reader? In focusing on the message, are the graphics ambiguous or clear? Do the graphics command attention?

4. Production: How does the production quality and professionalism rate as compared to other

work in the group? Are production techniques effective in the overall delivery of the message?

5. Results: Are there any applicable results of the campaign? Was the campaign pre-tested, posttested or tracked in some measurable form? Does the work achieve its stated objective(s)? If results are not provided, entries should be judged as nearly as possible to the stated objectives.

A campaign should not be rated highly if all other criteria are rated excellent and it fails in terms of its effectiveness.

This competition is not solely about excellent creative work. Rather, the competition rewards an entire process: setting appropriate goals, implementing the creative products, and meeting the stated objectives. Judges should also take into careful consideration whether the material has been produced by an agency or in-house.

Please be aware that at the top of each page within the judging system is the INMA Global Media Awards logo. By clicking on this logo, you will be directed to a Web site that provides “Categories,” “Entry Rules,” and “Helpful Tips” provided to news media executives entering the competition. We strongly recommend that you view these pages to ascertain the instructions given to participants.

GRAPHICS: One More Graphic

Gracias por visitar el sitio de Juantxo Cruz

ONE MORE GRAPHIC
Abayan Newspaper
Dubai

My comment:

That´s a fantastic work.
Visuals are really important on journalism nowdays.
Minute by minute, new readers don´t have time to read everything is comming to their email, twitter account, blog selection, traditional newspaper, Facebook page or any other source of information.

Infographics, interactive graphics, data visuals, diagrams or little charts helps a lot on that hurricane news season.
Readers love them.
Readers appreciate them.
Graphics help companies to develop a big brand.
People talk about graphics, and if they are fine, people get a good impressions on the company’s name.
Graphics attract the ads and the money.

The Abayan graphics I show here are really impressive.
That´s a real power for the Dubai new media.
Believe me, not all graphics in the world are good.
We see everyday a lot of nasty and ugly graphics.
You need the best people on your team to shock the world.
You need time and ideas to present the best graphics.
You need your editor´s support to keep calm on your department.
And you need patience to see the results.

Looking at your work, I see all these things.
Man, Abayan are shocking the world with these stunning works.
They are clear.
I see a great art direction.
They are not only infographics, they are amazing posters!
Illustrations are admirably excellents.
That´s quality.
That´s different.
That´s the Dubai´s true visual gun.

Congrats for all your team!!!!

PRESS: Ley de prensa, Hungría

Hungría.
Gobierno conservador (mayoría absoluta) de Viktor Orban (Fidesz), en alianza con los cristiano demócratas (2010, 52% de los votos).
Asumen la presidencia de la UE hasta julio.
Nueva ley de prensa, aprobada en otoño de 2010.
Entró en vigor el 1 de enero.
Crea un consejo de medios que determinará cuáles infringen la ley.

Budapest, Where are you going?

EU speechless over Hungary’s contentious media law

Gracias por visitar el sitio de Juantxo Cruz

Nepszabadsag
«La libertad de prensa en Hungría llega a su fin».
Budapest, Hungría.
80.000 copias de tirada.
Izquierda.
Desde 1956.
Portada del lunes.
Impreso en 23 idiomas para protestar por la falta de libertad de prensa, justo cuando Hungría toma la presidencia de la UE.

Gracias por visitar el sitio de Juantxo Cruz

Népszava
Se une a la protesta.
Social demócrata.
Desde 1877
Budapest.
Fue el diario oficial del Partido Demócratico Social Húgaro.

GRAPHICS: Barómetro de medios, KPMG

Anytime, anywhere
The rising demand of media on the move KPMG’s media and entertainment barometer kpmg.co.uk

Third Media and Entertainment Barometer, a six-monthly consumer survey conducted on behalf of KPMG byYouGov.

«Over the past year traditional media has held up well, and despite the ever growing availability of online media, consumers still expect and consume both. This has led to a mixed ecology, with people accessing content in the traditional way and online. The popularity of consuming media in the traditional way remains very resilient.» David Elms, KPMG

Gracias por visitar el sitio de Juantxo Cruz

Medios tradicionales.
Descensos en radio y diario, aumentan la TVs y las revistas.

Gracias por visitar el sitio de Juantxo Cruz

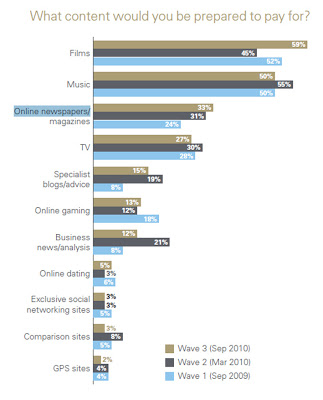
Aumenta los encuestados que pagarían por contenidos en la red.
Para periódicos online, del 24% al 33% en un año.

Gracias por visitar el sitio de Juantxo Cruz

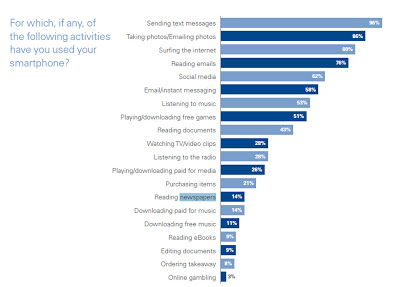
Los móviles no son para leer periódicos.

Gracias por visitar el sitio de Juantxo Cruz

Sólo el 2% de los encuestados tiene tableta.
El 16% lee diarios en el dispositivo.

Paywalls & Subscriptions

Subscribers most commonly paid for music (23 percent), online gaming (21 percent), business news/analysis (19 percent), online newspapers/ magazines (19 percent) and TV (19 percent).

Newspapers, books and print magazines

86 percent of consumers said they preferred to consume media offl ine rather than online. The most popular reason was a preference to reading physical copies.

Amongst those who had engaged in new media activities, the highest mean spend was on digital books, with 22 percent of those spending more than £5.

Over the past six months there had been a small increase in the proportion reading digital books.

– Newspaper and magazine readers aged 18-34 were less likely to pay for print media compared with the general population.

– Some major national newspaper groups have introduced paywalls for their online content, and all eyes have been on whether they are likely to be successful in the long term. Our survey suggests that as long as content is available for free elsewhere, the majority of consumers (79 percent) would rather find a different provider than pay for content online.

KPMG in the UK has over 10,000 partners and staff working in 22 offices and is part of a strong global network of member firms. Our vision is simple – to turn knowledge into value for the benefit of our clients, people and our capital markets.

POSTERS: La gran guerra de los medios, 1914-18

Gracias por visitar el sitio de Juantxo Cruz

La guerra de los medios, 1914-18
Exposición en BDIC, París

du 27 octobre 2010 au 16 janvier 2011

Fruit d’un partenariat franco-allemand établi entre la Bibliothèque nationale et universitaire de Strasbourg, la Württembergische Landesbibliothek de Stuttgart, la Bibliothèque nationale de France et la BDIC, cette exposition, qui a déjà été présentée aux publics strasbourgeois et allemand, rassemble les collections de guerre de ces quatre institutions. Celles-ci ont en commun d’avoir su collecter, dès les prémices du conflit, une riche documentation autour de la Grande Guerre.

GRAPHICS: España, sin impresos, 2024

Gracias por visitar el sitio de Juantxo Cruz

¿Cuándo morirán los diarios impresos?
Gráfico de Futureexploration.
Ross Dawson, futurista.

Ross Dawson is globally recognized as a leading futurist, entrepreneur, keynote speaker, strategy advisor, and bestselling author. He is Founding Chairman of four companies: professional services and venture firm Advanced Human Technologies, future and strategy consulting group Future Exploration Network, leading events firm The Insight Exchange, and influence ratings start-up Repyoot.

Ross is author most recently of Implementing Enterprise 2.0, the prescient Living Networks, which anticipated the social network revolution, and the Amazon.com bestseller Developing Knowledge-Based Client Relationships (click on the links for free chapter downloads). He is based in Sydney and San Francisco with his wife jewellery designer Victoria Buckley and two beautiful young daughters.

Below are the factors:

FACTORS DRIVING THE PACE OF NEWSPAPER EXTINCTION
GLOBAL
Increased cost performance of mobile phones
Increased cost performance of tablets/ e-readers
Development of high performance digital paper
Changes in newsprint and print production costs
Uptake of digital news monetization mechanisms
Trends in advertising spend and allocation
Development of open platforms

NATIONAL

Technology uptake
Fixed bandwidth availability and costs
Mobile bandwidth availability and costs
Smartphone and e-reader penetration

Economic development
Economic growth rate
Wealth inequality
Urban/ regional wealth disparity

Industry structure
Financial position of leading newspapers
Balance of advertising and print sales revenue
Newspaper distribution structures

Demographics
Age structure, birth rates, and immigration
Degree of urbanization
Increase in literacy

Government
Degree of regulation
Government financial support for media
Censorship and obstruction

Consumer behaviors
Media channel preferences
Willingness to pay for news
Relative interest in local and global news

!Gracias por visitar mi sitio! | Copyright © 1992- 2024 juantxo_cruz. Todos los derechos reservados.