eXplorer Statistics
National Center for Visual Analytics (NCVA)
Suecia
Programación y análisis de la estadística.
«GeoAnalytics Visualization»
Introducción.

Usuarios:
The WorlBank
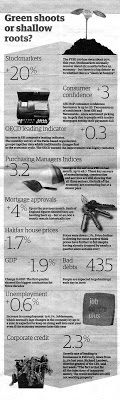
The Economist
The BBC
Eurostat
OCDE
Statistic Denmark
City of Göteborg
Ericsson
Unilever
National Center for Visual Analytics (NCVA) is a Swedish national resource funded through the Swedish Knowledge Foundation’s (KK-Stiftelsen) Visualization Program including VINNOVA, SSF, ISA and Vårdalstiftelsen and our industrial and government research partners. NCVA will help to spread geovisual and visual analytics technology into industry and government agencies.
NCVA is managed by Professor Mikael Jern VITA/ITN
Strategies
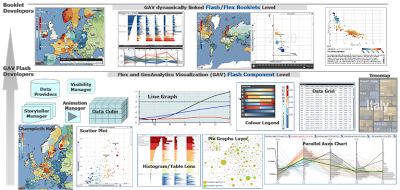
Programming each new Visual Analytics application from scratch is a complex and expensive task and a very inefficient way to work. A high-level toolkit, comprising many well-tested and compatible components, will make this process far less time-consuming and help ensure the correct functioning of each new application produced. To achieve this we build upon our «GeoAnalytics Visualization» framework, GAV, to provide a generic visualization framework for a diverse range of application areas and fully integrated with web tools such as Flash/Flex (GAV Flash) or optimized for performance with Microsoft DirectX (GAV). This framework is designed to provide integrated views of large information spaces, coordinated viewing of information in context, and to approach complex information through the use the overview and detail paradigm. These are the principles behind the VA concept which have made it such a powerful idea in the scientific community. NCVA will show the effectiveness of the technology and provide results in four distinct forms:
1.Valuable applications, addressing key concerns for our partners in industry, public services and academia.
2.New or enhanced methods within GAV framework developed for these purposes but which will then be available to users in other potential areas of interest.
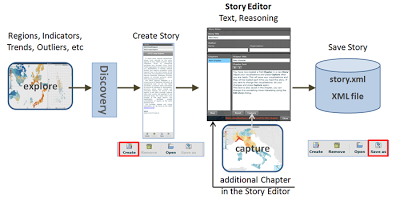
3.Novel techniques to facilitate the recording, review and dissemination of the reasoning within the VA process allowing the analyst to use interactive ‘story-telling’ to convey how conclusions are reached, improving the credibility of the results obtained.
4.New results from evaluation of these applications and techniques in the workplace context, feeding back into new and improved developments in a continuous cycle.
Applied research will be carried out in the context of a number of applications, drawn from diverse areas associated with the activities of the industrial partners, showing the generality of the underlying framework. Each of these applications can also be seen as a demonstrator of the technology. In this work, we will follow a ‘science-to-solutions’ approach to address the entire research, development and deployment process. The strong engagement by industry and public service partners that depend on state-of-the-art VA tools will guarantee that users will be involved from the start and will participate in the definition of the applied research agenda. The partners will, in turn, gain access to front line research, prototypes and components for integrating new and innovative VA tools.

Postal addresses
Linköping
All units but the Faculty of Health Sciences
Linköping University
SE-581 83 LINKÖPING
Sweden
Tel: +46 13 28 10 00
Fax: +46 13 14 94 03
e-mail: liu@liu.se
Please notice that questions regarding study programmes, admission, application procedures, enrolment etc, should be sent to studyinfo@liu.se
Faculty of Health Sciences
Hälsouniversitetet
Universitetssjukhuset
SE-581 85 LINKÖPING
Tel: +46 13 22 20 00
Norrköping
All units
Linköping University
Campus Norrkšping
SE-601 74 NORRKÖPING
Tel switchboard: +46 11 36 30 00
Fax: +46 11 26 58 50
Economist: http://www.economist.com/britain-in-context/
OECD: http://www.oecd.org/innovation/strategy/charting
Statistics Denmark: http://www.dst.dk/OmDS/BagTal/Arkiv/2010-05-06-Motorcykler.aspx
OECD: http://vitagate.itn.liu.se/GAV/development/testVislet/
SCB and Eurostat: http://swedeneurostat.blogspot.com/2010/03/education-in-eu-example-with-vislets.html#links
Goteborg City: http://www.samhallsutvecklingen.se/413/stora-inkomstskillnader-i-goteborg/
OECD eXplorer: http://www.ncomva.com/?p=125 (NComVA Vislet demo with OECD eXplorer ageing population in EU 1990-2008).
OECD Factbook: http://www.ncomva.com/?page_id=111 (NComVA Vislet Demo with OECD Factbook – fertility versus women employment rate for 1970-2006)
OECD Regional development: http://www.oecd.org/gov/regional/statisticsindicators
World eXplorer: http://www.ncomva.com/?page_id=297/