GRAPHICS: Travel Gold Rush 2020, Amadeus

The Travel Gold Rush 2020

Pioneering growth and profitability trends in the travel sector
Developed by Oxford Economics in partnership with Amadeus

Gracias por visitar el sitio de Juantxo Cruz

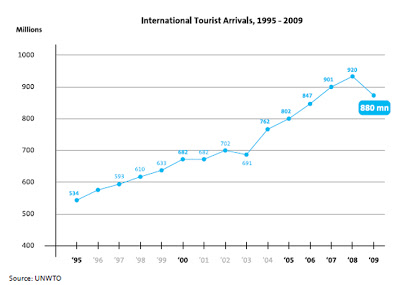
La caída del turismo, 2009
-4,2%

However, global tourism arrivals fell by 4.2% in 2009 to 880 million as the effects of recession hit. Tourism receipts ($852 billion) were 5.7% below the levels of 2008 – suggesting that people were also spending less per trip if they did travel.

Gracias por visitar el sitio de Juantxo Cruz

Los ingresos adicionales
Antes incluidos en el billete, ahora desglosados.
– Maletas
– Equipaciones
– Comidas
– Snacks
– Bebidas
– Medicinas
– Seguridad de élite
– Garantías de asiento
– Posición en el avión

Ingresos adicionales
2006: 1.700 millones de euros
2009: 11.000 millones de euros.

According to IdeaWorks, worldwide airline ancillary revenues were some €11 billion in 2009 – up from only €1.7 billion in 2006. 72% of airlines worldwide derive ancillary revenue from hotel and rental car bookings.

Gracias por visitar el sitio de Juantxo Cruz

Evolución de los billetes económicos y los de primera.
Un gran ejemplo para ilustrar a quién afecta la crisis económica.

Gracias por visitar el sitio de Juantxo Cruz

Los cambios en las destinos, 2020

About Amadeus

The leading provider of IT solutions to your tourism and travel industry
Amadeus is a leading transaction processor for the global travel and tourism industry, providing transaction processing power and technology solutions to both travel providers (including full service carriers and low-cost airlines, hotels, rail operators, cruise and ferry operators, car rental companies and tour operators) and travel agencies (both online and offline). The company acts both as a worldwide network connecting travel providers and travel agencies through a highly effective processing platform for the distribution of travel products and services (through our Distribution business), and as a provider of a comprehensive portfolio of IT solutions which automate certain mission-critical business processes, such as reservations, inventory management and operations for travel providers (through our IT solutions business).

About Oxford Economics

Economics matters. Combining skilled analysis with detailed economic and industry information provides a sound foundation for your business decisions and thought leadership activities.

Oxford Economics is one of the world’s foremost global forecasting and research consultancies. Founded in 1981 as a joint venture with Templeton College, the business college of Oxford University, Oxford Economics has since grown into a major independent provider of global economic, industry and business analysis.

A leader in quantitative analysis, Oxford Economics relies on detailed economic research and cutting-edge analytical tools to help our clients assess the opportunities, challenges and strategic choices they face now and in the future.

By using a suite of time-tested models, our team of more than 60 professional economists and industry experts provide you with the analysis you need for making decisions and developing thought leadership. We help you identify future global economic and business trends and what they will mean for your organisation, industry, market or customers. And we present our insights and foresights in clear business language, backed by a brand you can trust.

INDEX: ATCO-hour, productividad y control aéreo

Gracias por visitar el sitio de Juantxo Cruz

PRR 2009
Performance Review Report
An Assessment of Air Traffic Management in Europe
during the Calendar Year 2009
European Organisation for the Safety of Air Navigation
EUROCONTROL, 96, rue de la Fusée, B-1130 Brussels, Belgium

Gracias por visitar el sitio de Juantxo Cruz

Cuadro de los términos internacionales para expresar la productividad de los controladores aéreos.

ACC (Area Control Center) Responsible for the safe flow of traffic along airways (–> En-route) and in certain portions of terminal control areas (–> APP). Significant horizontal and vertical growth in the areas to be controlled requires subdivision into various sectors of activity, either geographically or according to altitude, depending on traffic density.

Air Traffic Controller (ATCO) Manages and monitors, from the airport of take-off to that of landing, all of the aircraft present in the portion of airspace for which he or she is responsible. Skyguide employs about 450 civil ATCOs and 90 military ATCOs. The profession of ATCO is open to both men and women.

‘Sector productivity: This is the ratio of the output, measured by the flight-hours controlled by the ACC, to (area control) sector-hours open. This indicator shows, on
average, how many aircraft are simultaneously in a sector for a given ACC. All else being equal, higher sector productivity will improve ATCO-hour productivity.

 Staffing per sector: This is the ratio of ATCO-hours on duty to sector-hours open. This indicator shows, on average, how many ATCOs are used to man a sector. All else being equal, a reduction in the staffing per sector will increase ATCO-hour productivity.

ATCO-hour productivity can be more easily compared in an international benchmarking
environment. The average number of hours on duty is not a performance indicator per se and is mostly determined by the social bargaining and regulatory framework that prevails in each ANSP and State. Moreover, average hours on duty should be seen in the context of the employment costs’.

Gracias por visitar el sitio de Juantxo Cruz

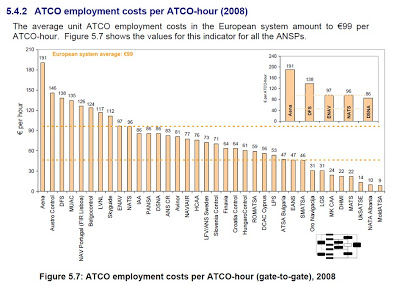
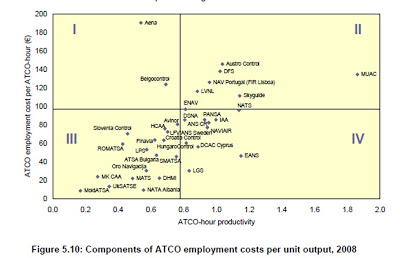
El coste del empleo por hora de control (ATCO).
El último dato es de 2008.
AENA tendría el coste más alto de Europa.
191 euros por hora de control.
La media es 99 euros.

Gracias por visitar el sitio de Juantxo Cruz

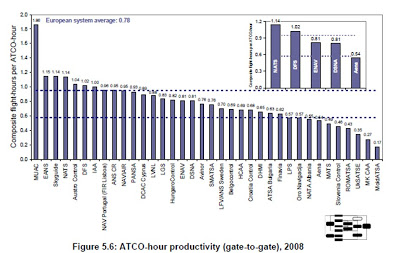
Productividad = nº compuesto de horas de vuelo controladas / nº de horas de ATCOs in OPS (Composite flight-hours per ATCO-hour)

El índice que mide la productividad del control aéreo (ATCO-hour productivity)
AENA, bajo, según EUROCONTROL.

Gracias por visitar el sitio de Juantxo Cruz

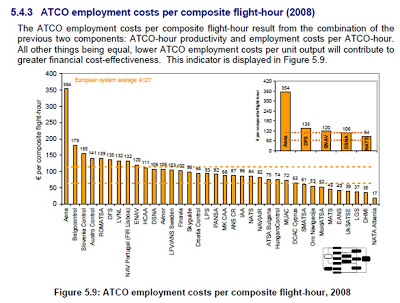
Coste del empleo por hora de vuelo.
AENA: 354 euros
Media: 127 euros

Gracias por visitar el sitio de Juantxo Cruz

Relación de la productividad con el coste del empleo.

‘In terms of the cost base, Aena is the largest European ANSP,
with costs amounting to around 16% of the European total (for
a traffic representing 10% of the European total).
Over five years, its traffic has grown by +4% a year, but has
slightly declined in 2008. Over the period Aena experienced
the highest traffic growth among the five largest ANSPs
(+17%). Overall, the complexity of its traffic is intermediate.
Among the other four large ANSPs, Aena’s traffic shows
significantly less complexity’.

ATM Cost-Effectiveness (ACE)
2008 Benchmarking Report
Prepared by the Performance Review Unit (PRU)
with the ACEWorking Group
Junio de 2010

La Asociación Profesional de Controladores de Tránsito Aéreo no está de acuerdo con los datos de EUROCONTROL:

– ‘En primer lugar es importante destacar que estos estudios de Eurocontrol comparan proveedores de servicios de navegación aérea que en absoluto son homogéneos.
– Aena no ha seguido fielmente las directrices de EUROCONTROL (Performance Review Comission, PRC) en cuanto a la información facilitada para la elaboración de los informes comparativos, información que por otro lado no es objeto de auditoría alguna’.

Informe de APROCTA: las mentiras sobre los controladores.

GRAPHICS: Ultra high density seat!

Gracias por visitar el sitio de Juantxo Cruz

Por Aviointerior.
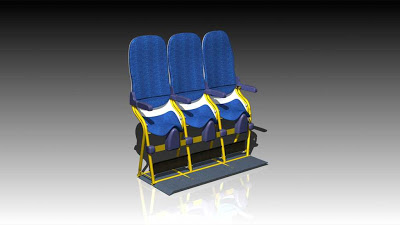
The SkyRider.
Diseño italiano.

Gracias por visitar el sitio de Juantxo Cruz

Since 1974 Aviointeriors has supplied airline companies with customized aircraft cabin interior products. Focused mainly on passenger seat design, engineering and manufacturing, Aviointeriors also performs design, engineering and production of aircraft cabin furniture, sidewalls, galleys, lavatories. Its Railinteriors subsidiary, also supplies complete interiors for rolling stock in «high tech» composite materials.

Aviointeriors S.p.a.
Via Appia Km. 66,4
04013 Latina, ITALY

Gracias por visitar el sitio de Juantxo Cruz

Air Transport News
12 de julio

GRAPHICS: Estudios de la nube de ceniza

17 de abril de 2010, NASA

Gracias por visitar el sitio de Juantxo Cruz

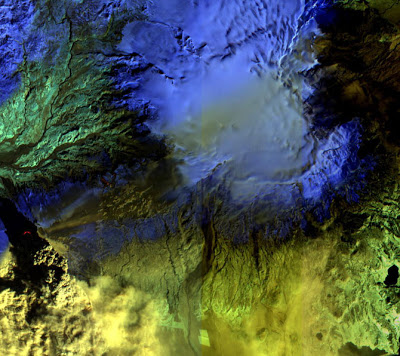
False-color infrared image of Iceland’s Eyjafjallajökull volcano acquired Sat., April 17, 2010, by the Advanced Land Imager (ALI) instrument onboard NASA’s Earth Observing-1 (EO-1) spacecraft. Strong thermal emissions, shown in red, are visible at the base of the ash plume and above and to the right from earlier lava flows located at Fimmvorduhals. Image credit: NASA/JPL/EO-1 Mission/GSFC/Ashley Davies

Gracias por visitar el sitio de Juantxo Cruz

19 de abril, espectómetro
The Multi-angle Imaging SpectroRadiometer (MISR) instrument on NASA’s Terra satellite captured these different views of the ash plume from Iceland’s erupting Eyjafjallajökull volcano on April 19, 2010, which provide information on the amount and type of particles in the plume itself. Left: a true-color nadir (vertical) view; left-center: a map of retrieved aerosol optical depth, a measure of the amount of particulate matter in the atmosphere; right-center: the Angstrom exponent, which is related to average particle size; right: particle shape. Image credit: NASA/GSFC/LaRC/JPL, MISR Team

Gracias por visitar el sitio de Juantxo Cruz

A computer-analyzed map of ash plume heights, corrected to compensate for the effects of wind. Reds are highest, blue lowest. Image credit: NASA/GSFC/LaRC/JPL, MISR Team

Gracias por visitar el sitio de Juantxo Cruz

Photo-like satellite images give us a view of the world that is relatively familiar to us; the images look a lot like a digital photo. But for many scientific studies, a photo-like image doesn’t provide enough information. For example, to predict where the ash from an eruption may spread or how it might interact with clouds, scientists need a mathematical way to describe the concentration of particles in the air.

Gracias por visitar el sitio de Juantxo Cruz

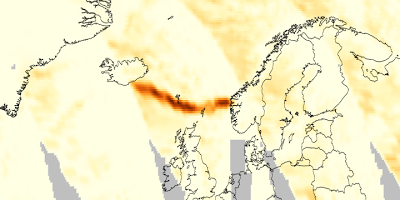
Cloud-Aerosol Lidar and Infrared Pathfinder Satellite Observations (CALIPSO) satellite watches Eyjafjallajökull’s plume drift over northern Europe. Credit: NASA/Kurt Severance and Tim Marvel

GERMAN AEROSPACE CENTER
Resultados del estudio realizado con un Falcon 20E para observar el impacto de las cenizas en el aparato.
Realizado el 19 de abril, publicado el 20.

La prueba fue satisfactoria, en Alemania.
No se apreciaron daños.

Gracias por visitar el sitio de Juantxo Cruz

On 19 April 2010 the DLR ‘Falcon 20E’ research aircraft took off from Oberpfaffenhofen at 16:00 CEST to examine the ash cloud from the Icelandic volcano Eyafjallajoküll. The route for this measurement flight led from Oberpfaffenhofen to Leipzig, then over Hamburg and on to Bilthoven (the Netherlands) and returned via Stuttgart to Oberpfaffenhofen.

Gracias por visitar el sitio de Juantxo Cruz

Figure 1: Flight route of the DLR Falcon on 19 April 2010

Gracias por visitar el sitio de Juantxo Cruz

Figure 2: FLEXPART simulations of the time evolution of an aerosol tracer released from the Iceland volcano (release rate inferred from MSG observations) since 14 April 2010. Total columns (pmol/mol) on 16 April, 15 UTC (a), 17 April, 15 UTC (b), 18 April, 15 UTC, and 19 April, 17 UTC (conditions during the Falcon flight).

Gracias por visitar el sitio de Juantxo Cruz

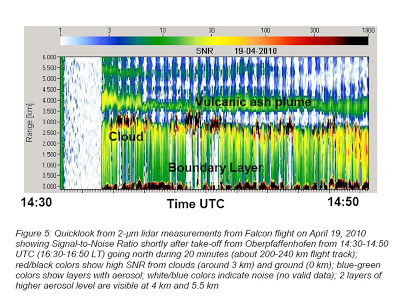
Figure 5: Quicklook from 2-μm lidar measurements from Falcon flight on April 19, 2010 showing Signal-to-Noise Ratio shortly after take-off from Oberpfaffenhofen from 14:30-14:50 UTC (16:30-16:50 LT) going north during 20 minutes (about 200-240 km flight track); red/black colors show high SNR from clouds (around 3 km) and ground (0 km); blue-green colors show layers with aerosol; white/blue colors indicate noise (no valid data); 2 layers of higher aerosol level are visible at 4 km and 5.5 km

MAPS: Mancha polémica

Gracias por visitar el sitio de Juantxo Cruz

Icelandair GROUP acaba de publicar una nueva web con información sobre el volcán.
Este es el mapa que da hoy sobre la mancha contaminante en Islandia (mini mancha).

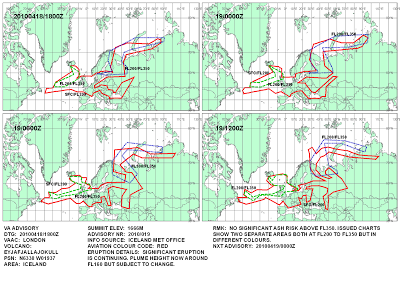
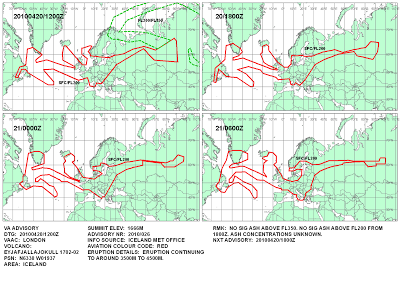
Este son los mapas de las previsiones de la mancha de ceniza que METOFFICE ha publicado todos estos días.
La fuente es la Oficina Meteorológica de Islandia.
No se ha dado información precisa de cómo se han elaborado estos mapas.
No hemos visto fotografías detalladas de satélite (difíciles de ver por las borrascas y las nubes, pero el problema requería algo más científico que estos mapas)
No hemos visto estudios precisos sobre el impacto de las cenizas en los motores.
Tampoco hemos visto los resultados de las pruebas que las compañías hicieron en los motores.

Ayer, CIVIL AVIATION Authority del Reino Unido publicó unas nuevas líneas maestras sobre el uso del espacio aéreo.
Hoy por la tarde se esperan los primeros vuelos desde Heathrow.

Gracias por visitar el sitio de Juantxo Cruz

14 de abril

Gracias por visitar el sitio de Juantxo Cruz

16 de abril

Gracias por visitar el sitio de Juantxo Cruz

17 de abril
Caos total

Gracias por visitar el sitio de Juantxo Cruz

18 de abril

Gracias por visitar el sitio de Juantxo Cruz

19 de abril

Gracias por visitar el sitio de Juantxo Cruz

20 de abril

Gracias por visitar el sitio de Juantxo Cruz

21 de abril
Fin del problema.

Gracias por visitar el sitio de Juantxo Cruz

Morgunbladid, Islandia
Los ganaderos del sur de Islandia son los que más motivos tienen para preocuparse.
Animales bajo techo, agua potable y comida sana.
Se esperan fuertes lluvias que limpien el aire y el suelo. Esperan un cosechón. Las cenizas son un excelente abono.

Gracias por visitar el sitio de Juantxo Cruz

Neue Westfälische, Alemania
Las finanzas del sector aéreo en el suelo.
Los ejecutivos piden ayudas al gobierno.

Gracias por visitar el sitio de Juantxo Cruz

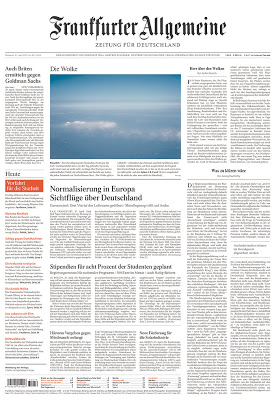
Frankfurter Allgemeine, Alemania
La nube.

Gracias por visitar el sitio de Juantxo Cruz

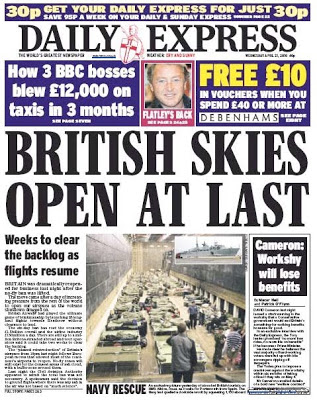
Daily Express, UK
Finalmente, los cielos abiertos.

Gracias por visitar el sitio de Juantxo Cruz

The Daily Telegraph, UK
¿Por qué se impuso la restricción?
Glups, Nick Clegg puede freir en cenizas esta noche a Brown.

Gracias por visitar el sitio de Juantxo Cruz

Südwest Presse, Alemania
Las líneas aéreas desafían las restricciones

Esto, ¿no era de antes de ayer?

Gracias por visitar el sitio de Juantxo Cruz

Rheinische Post, Alemania
Estudio sobre las cenizas
La ceniza: tan dura como el acero.

Sí, pero se las llevó el viento.

PRESS: Martes de ceniza

Gracias por visitar el sitio de Juantxo Cruz

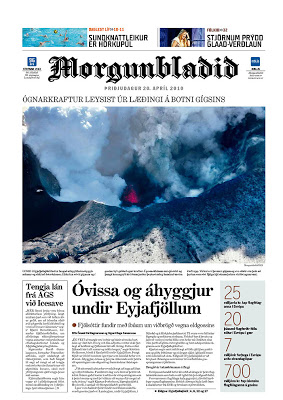
Morgunbladid, Islandia

Incertidumbre y preocupación bajo la isla de las montañas.
Fuerza amenazante debajo de la tierra.
Mientras, las producción de cenizas disminuye.
No significa que vaya a parar.
Llegan a menos altura.
‘According to meteorologist Halldor Bjornsson, it is not possible to say the reduced ash fall means the eruption is winding down; but farmers are welcoming the development nevertheless. At its peak, 750 tonnes of ash were spewing out of the volcano every second. The eruption has been upgraded from small to medium in size’.
10 centímetros de cenizas en el suelo.
El problema se les cae encima.
Tres vídeos de las explosiones de ayer.
Gracias por visitar el sitio de Juantxo Cruz
Mapa turístico del sur de Islandia.

GRAPHICS: Airbus A330-200, corte vertical

Deslumbrante estudio sobre el accidente en Weather Graphics.
Por Tim Vasquez (Texas).
Vía What´s Next.
Thanks, Juan Antonio, great job!.
Very useful on these lack of information days!

Gracias por visitar el sitio de Juantxo Cruz

Figure 13.
Cross-section of Air France 447 flight track through thunderstorm cluster, based on satellite imagery analysis and conceptual MCS models. Light shading is precipitation near the surface; medium shading is cloud material, and dark shading is suspected updraft areas. The flight may have deviated several miles west to avoid the SALPO storm; whether they did or not is unknown; but they almost certainly went through the bulk of the MCS as shown here. ©2009 Tim Vasquez. Not for free reproduction in commercial news outlets, sorry; it represents too much original work.

MAPS: Airbus A330-200, la ruta

Gracias por visitar el sitio de Juantxo Cruz

Infografía a la venta de Golden Section Graphics.
Jan Schwochow comenta a sus clientes:

‘The graphic shows the Air France Flight AF 447.
It shows ALL the flight rotes of the civil air traffic.
And the clouds of the storm in that special night.

I know that it is very late for that graphic but we need a lot of time for good research and putting all that things together.
Was it worthwhile?’

Gran trabajo de documentación de las rutas mundiales y magnífica presentación en el mapa. Sí, quizás demasiado tarde.
Anyway, GSG, una de las agencias líderes en la información visual mundial.

!Gracias por visitar mi sitio! | Copyright © 1992- 2024 juantxo_cruz. Todos los derechos reservados.