UNITS: Kilogramo

Redefinición del kilogramo.
Las masa de un decímetro de agua destilada(un litro) en la densidad máxima del agua, una atmósfera de presión y 3,98 °C (1785)
El kilogramo fue redefinido mediante un objeto
Unidad de masa centenaria (definición actual de 1901).
Origen en las reformas de la revolución francesa.
Nueva definición del concepto de masa.
Basada en las propiedades que no cambian en la naturaleza en vez de un elemento físico.
Fuerza, velocidad, voltaje y resistencia.
Constante de Planck.

Gracias por visitar el sitio de Juantxo Cruz

Prototipo de kilogramo internacional.
Cilindro de platinium-iridium
Desde 1880
En Sèvres, Francia.
Sistema internacional (SI).
El «prototipo internacional» es la única medida oficial de masa. Varios proyectos intentan acabar con este pedazo de metal, y sustituirlo por una definición absoluta.

Gracias por visitar el sitio de Juantxo Cruz

U.S. National Prototype Kilogram.
90% platinum
10% iridium.
Desde 2008

Gracias por visitar el sitio de Juantxo Cruz

Proyecto australiano.
CSIRO
Propuesta esférica de silicona.
Diámetro de 93 mm.

GRAPHICS: Barómetro de medios, KPMG

Anytime, anywhere
The rising demand of media on the move KPMG’s media and entertainment barometer kpmg.co.uk

Third Media and Entertainment Barometer, a six-monthly consumer survey conducted on behalf of KPMG byYouGov.

«Over the past year traditional media has held up well, and despite the ever growing availability of online media, consumers still expect and consume both. This has led to a mixed ecology, with people accessing content in the traditional way and online. The popularity of consuming media in the traditional way remains very resilient.» David Elms, KPMG

Gracias por visitar el sitio de Juantxo Cruz

Medios tradicionales.
Descensos en radio y diario, aumentan la TVs y las revistas.

Gracias por visitar el sitio de Juantxo Cruz

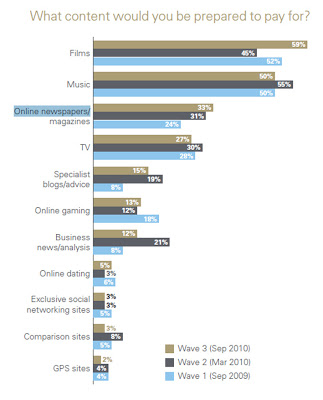
Aumenta los encuestados que pagarían por contenidos en la red.
Para periódicos online, del 24% al 33% en un año.

Gracias por visitar el sitio de Juantxo Cruz

Los móviles no son para leer periódicos.

Gracias por visitar el sitio de Juantxo Cruz

Sólo el 2% de los encuestados tiene tableta.
El 16% lee diarios en el dispositivo.

Paywalls & Subscriptions

Subscribers most commonly paid for music (23 percent), online gaming (21 percent), business news/analysis (19 percent), online newspapers/ magazines (19 percent) and TV (19 percent).

Newspapers, books and print magazines

86 percent of consumers said they preferred to consume media offl ine rather than online. The most popular reason was a preference to reading physical copies.

Amongst those who had engaged in new media activities, the highest mean spend was on digital books, with 22 percent of those spending more than £5.

Over the past six months there had been a small increase in the proportion reading digital books.

– Newspaper and magazine readers aged 18-34 were less likely to pay for print media compared with the general population.

– Some major national newspaper groups have introduced paywalls for their online content, and all eyes have been on whether they are likely to be successful in the long term. Our survey suggests that as long as content is available for free elsewhere, the majority of consumers (79 percent) would rather find a different provider than pay for content online.

KPMG in the UK has over 10,000 partners and staff working in 22 offices and is part of a strong global network of member firms. Our vision is simple – to turn knowledge into value for the benefit of our clients, people and our capital markets.

GRAPHICS: Travel Gold Rush 2020, Amadeus

The Travel Gold Rush 2020

Pioneering growth and profitability trends in the travel sector
Developed by Oxford Economics in partnership with Amadeus

Gracias por visitar el sitio de Juantxo Cruz

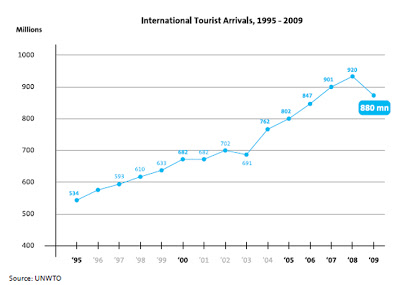
La caída del turismo, 2009
-4,2%

However, global tourism arrivals fell by 4.2% in 2009 to 880 million as the effects of recession hit. Tourism receipts ($852 billion) were 5.7% below the levels of 2008 – suggesting that people were also spending less per trip if they did travel.

Gracias por visitar el sitio de Juantxo Cruz

Los ingresos adicionales
Antes incluidos en el billete, ahora desglosados.
– Maletas
– Equipaciones
– Comidas
– Snacks
– Bebidas
– Medicinas
– Seguridad de élite
– Garantías de asiento
– Posición en el avión

Ingresos adicionales
2006: 1.700 millones de euros
2009: 11.000 millones de euros.

According to IdeaWorks, worldwide airline ancillary revenues were some €11 billion in 2009 – up from only €1.7 billion in 2006. 72% of airlines worldwide derive ancillary revenue from hotel and rental car bookings.

Gracias por visitar el sitio de Juantxo Cruz

Evolución de los billetes económicos y los de primera.
Un gran ejemplo para ilustrar a quién afecta la crisis económica.

Gracias por visitar el sitio de Juantxo Cruz

Los cambios en las destinos, 2020

About Amadeus

The leading provider of IT solutions to your tourism and travel industry
Amadeus is a leading transaction processor for the global travel and tourism industry, providing transaction processing power and technology solutions to both travel providers (including full service carriers and low-cost airlines, hotels, rail operators, cruise and ferry operators, car rental companies and tour operators) and travel agencies (both online and offline). The company acts both as a worldwide network connecting travel providers and travel agencies through a highly effective processing platform for the distribution of travel products and services (through our Distribution business), and as a provider of a comprehensive portfolio of IT solutions which automate certain mission-critical business processes, such as reservations, inventory management and operations for travel providers (through our IT solutions business).

About Oxford Economics

Economics matters. Combining skilled analysis with detailed economic and industry information provides a sound foundation for your business decisions and thought leadership activities.

Oxford Economics is one of the world’s foremost global forecasting and research consultancies. Founded in 1981 as a joint venture with Templeton College, the business college of Oxford University, Oxford Economics has since grown into a major independent provider of global economic, industry and business analysis.

A leader in quantitative analysis, Oxford Economics relies on detailed economic research and cutting-edge analytical tools to help our clients assess the opportunities, challenges and strategic choices they face now and in the future.

By using a suite of time-tested models, our team of more than 60 professional economists and industry experts provide you with the analysis you need for making decisions and developing thought leadership. We help you identify future global economic and business trends and what they will mean for your organisation, industry, market or customers. And we present our insights and foresights in clear business language, backed by a brand you can trust.

WWW: The Connected Kingdom

Gracias por visitar el sitio de Juantxo Cruz

The Connected Kingdom
How The Internet Is Transforming the UK Economy
The Boston Consulting Group

This report reveals just how big the UK’s Internet economy is right now. It’s worth 100bn to the UK – more than the construction, utilities or transport sectors. The report is also important because it tells us how big the UK’s Internet economy could be in the future – potentially 10% of GDP. As we face uncertain economic times ahead, this report suggests that Internet companies could be at the heart of our future recovery.

Gracias por visitar el sitio de Juantxo Cruz

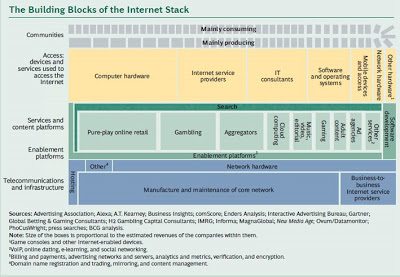
Indice de gasto electrónico.

Google commissioned The Boston Consulting Group to produce an independent analysis of the value of the UK’s Internet economy, the factors that are driving this, how we compare to other countries, and how this will change in the future. Google wants to help UK businesses get online and use the Internet to grow and have run programmes like ‘Getting British Business Online’ to help businesses create their first website, we’re also interested in helping existing online businesses to grow further.

Gracias por visitar el sitio de Juantxo Cruz

‘The Boston Consulting Group (BCG) is a global management consulting firm and the world’s leading advisor on business strategy. We partner with clients in all sectors and regions to identify their highest-value opportunities, address their most critical challenges, and transform their businesses. Our customized approach combines deep insight into the dynamics of companies and markets with close collaboration at all levels of the client organisation. This ensure that our clients achieve sustainable competitive advantage, build more capable organisations, and secure lasting results. Founded in 1963, BCG is a private company with 70 offices in 41 countries. For more information, please visit www.bcg.com.

STATS: Tea Party, Public Religion

Religion and The Tea Party in the 2010 Election
An Analysis of the Third Biennial American Values Survey
Octubre, 2010
PUBLIC RELIGION RESEARCH INSTITUTE
WDC.

Gracias por visitar el sitio de Juantxo Cruz

% sobre la población general.

Gracias por visitar el sitio de Juantxo Cruz

Religión.
Cristianos.

Gracias por visitar el sitio de Juantxo Cruz

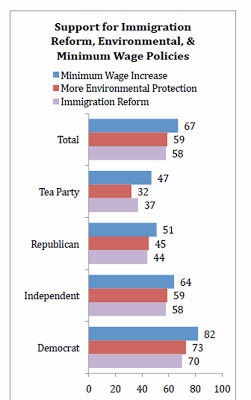
Defensa del individuo y sus capacidades frente al Estado.
Inmigración, obstáculo.

Gracias por visitar el sitio de Juantxo Cruz

Apoyan menos las protecciones social, medioambiental y del emigrante.

Public Religion Research Institute is a nonprofit, nonpartisan, independent firm specializing in research at the intersection of religion, values, and public policy. As a research organization, we do not take positions on, nor do we advocate for, particular policies. As members of the American Academy of Religion and the American Association for Public Opinion Research, our research team follows the highest academic research standards, including balance and transparency.

GRAPHICS: Reforma de las pensiones, FEDEA

Hacia un sistema público de pensiones sostenible, equitativo y transparente
7 oct. 2010

FEDEA-Fundación de Estudios de Economía Aplicada-
Desde 1985
Fábrica de ideas.

Gracias por visitar el sitio de Juantxo Cruz

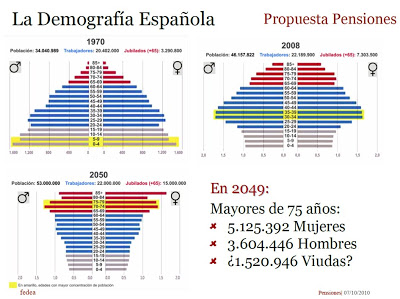
La pirámide insostenible. 2050.

Gracias por visitar el sitio de Juantxo Cruz

Según Fedea, la reforma es inevitable.
Hoy hay 4 personas trabajando por cada pensionistas.
En 2040, serán dos personas por pensionista.

Sus propuestas:

1.La pensión de jubilación tiene que ser proporcional a las cotizaciones efectivamente realizadas a lo largo de toda la vida laboral.

2.La edad de jubilación debe ser flexible y la pensión debe depender de la esperanza de vida en el momento de la jubilación.

3. Ante nuevos cambios demográficos y socioeconómicos, el sistema de pensiones debe contener elementos de ajuste automático.

Promotores
•Alfonso Arellano (FEDEA)
•Michele Boldrin (FEDEA y WuT)
•Juan Carlos Conesa (UAB)
•Javiér Diáz-Giménez (IESE)
•Juanjo Dolado (UC3M)
•Rafael Domenech (UV)
•Florentino Felgueroso (FEDEA)
•Angel de la Fuente (CSIC)
•Vincenzo Galasso (Bocconi)
•José Ignacio Garcia (UPO)
•Luis Garicano (FEDEA y LSE)
•José Antonio Herce (AFI)
•Sergi Jiménez (FEDEA y UPF)
•Cesar Molinas (Multa Paucis)
•Ana Montes (UM)
•Cio Patxot (UB)
•Juan Rubio (FEDEA y Duke)
•Alfonso Sánchez (UPO)
•Virginia Sánchez (UNICAN)
•Pablo Vázquez (FEDEA)

Gracias por visitar el sitio de Juantxo Cruz

Contribuciones.

STATS: Antiretrovirales vs SIDA

Towards Universal Access
Scaling up priority HIV/AIDS interventions in the health sector
2010
UNAIDS, UNICEF, WHO

Gracias por visitar el sitio de Juantxo Cruz

Aumenta la población con acceso a la terapia antiretroviral en los países con ingresos bajos y medios: 5,25 millones en 2009, +1,2 millones con respecto a 2008.
Pese a todo, 14,6 millones de personas necesitan el tratamiento.

Gracias por visitar el sitio de Juantxo Cruz

En España, 79.500 personas reciben la terapia (2009).

Gracias por visitar el sitio de Juantxo Cruz

La terapia antiretroviral reduce la incidencia y la mortalidad.

GRAPHICS: Estudios de la nube de ceniza

17 de abril de 2010, NASA

Gracias por visitar el sitio de Juantxo Cruz

False-color infrared image of Iceland’s Eyjafjallajökull volcano acquired Sat., April 17, 2010, by the Advanced Land Imager (ALI) instrument onboard NASA’s Earth Observing-1 (EO-1) spacecraft. Strong thermal emissions, shown in red, are visible at the base of the ash plume and above and to the right from earlier lava flows located at Fimmvorduhals. Image credit: NASA/JPL/EO-1 Mission/GSFC/Ashley Davies

Gracias por visitar el sitio de Juantxo Cruz

19 de abril, espectómetro
The Multi-angle Imaging SpectroRadiometer (MISR) instrument on NASA’s Terra satellite captured these different views of the ash plume from Iceland’s erupting Eyjafjallajökull volcano on April 19, 2010, which provide information on the amount and type of particles in the plume itself. Left: a true-color nadir (vertical) view; left-center: a map of retrieved aerosol optical depth, a measure of the amount of particulate matter in the atmosphere; right-center: the Angstrom exponent, which is related to average particle size; right: particle shape. Image credit: NASA/GSFC/LaRC/JPL, MISR Team

Gracias por visitar el sitio de Juantxo Cruz

A computer-analyzed map of ash plume heights, corrected to compensate for the effects of wind. Reds are highest, blue lowest. Image credit: NASA/GSFC/LaRC/JPL, MISR Team

Gracias por visitar el sitio de Juantxo Cruz

Photo-like satellite images give us a view of the world that is relatively familiar to us; the images look a lot like a digital photo. But for many scientific studies, a photo-like image doesn’t provide enough information. For example, to predict where the ash from an eruption may spread or how it might interact with clouds, scientists need a mathematical way to describe the concentration of particles in the air.
Gracias por visitar el sitio de Juantxo Cruz

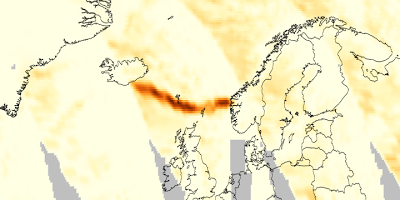
Cloud-Aerosol Lidar and Infrared Pathfinder Satellite Observations (CALIPSO) satellite watches Eyjafjallajökull’s plume drift over northern Europe. Credit: NASA/Kurt Severance and Tim Marvel

GERMAN AEROSPACE CENTER
Resultados del estudio realizado con un Falcon 20E para observar el impacto de las cenizas en el aparato.
Realizado el 19 de abril, publicado el 20.

La prueba fue satisfactoria, en Alemania.
No se apreciaron daños.

Gracias por visitar el sitio de Juantxo Cruz

On 19 April 2010 the DLR ‘Falcon 20E’ research aircraft took off from Oberpfaffenhofen at 16:00 CEST to examine the ash cloud from the Icelandic volcano Eyafjallajoküll. The route for this measurement flight led from Oberpfaffenhofen to Leipzig, then over Hamburg and on to Bilthoven (the Netherlands) and returned via Stuttgart to Oberpfaffenhofen.

Gracias por visitar el sitio de Juantxo Cruz

Figure 1: Flight route of the DLR Falcon on 19 April 2010

Gracias por visitar el sitio de Juantxo Cruz

Figure 2: FLEXPART simulations of the time evolution of an aerosol tracer released from the Iceland volcano (release rate inferred from MSG observations) since 14 April 2010. Total columns (pmol/mol) on 16 April, 15 UTC (a), 17 April, 15 UTC (b), 18 April, 15 UTC, and 19 April, 17 UTC (conditions during the Falcon flight).
Gracias por visitar el sitio de Juantxo Cruz

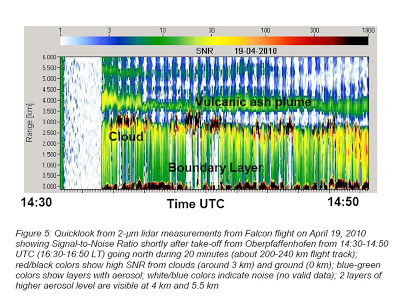
Figure 5: Quicklook from 2-μm lidar measurements from Falcon flight on April 19, 2010 showing Signal-to-Noise Ratio shortly after take-off from Oberpfaffenhofen from 14:30-14:50 UTC (16:30-16:50 LT) going north during 20 minutes (about 200-240 km flight track); red/black colors show high SNR from clouds (around 3 km) and ground (0 km); blue-green colors show layers with aerosol; white/blue colors indicate noise (no valid data); 2 layers of higher aerosol level are visible at 4 km and 5.5 km

GRAPHICS: Desempleo de los jóvenes, OCDE

OCDE, Directorate for Employment.
RISING YOUTH UNEMPLOYMENT DURING THE CRISIS: HOW TO PREVENT NEGATIVE LONG-TERM CONSEQUENCES ON A GENERATION?
OECD
2, rue André-Pascal
75775 Paris, CEDEX 16
France
Copyright OECD 2010

Gracias por visitar el sitio de Juantxo Cruz

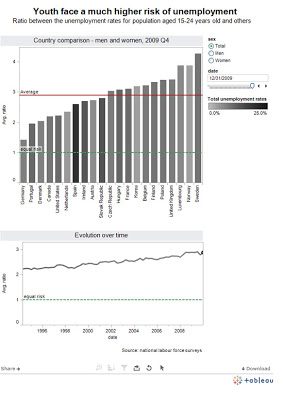
Estadística INTERACTIVA.
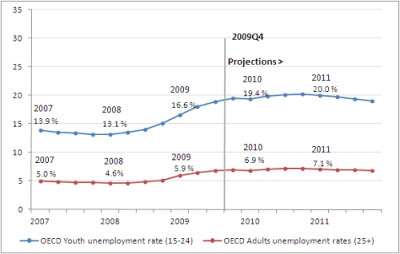
Unemployment has risen sharply during the recession, and young people have been particularly hard hit. Even in good times, the youth unemployment rate (15-to-24-year-olds) can be two to three times that of adults, but it has increased much more rapidly during the crisis; even in Germany, young people are now one and half times more likely to be unemployed than prime age workers, while in Sweden their risk is four times greater.

Gracias por visitar el sitio de Juantxo Cruz

VÍDEO estadístico.
There are currently nearly 15 million unemployed young people in the OECD area, about four million more than at the end of 2007.
In countries like France and Italy, about one youth in four on the labour market is unemployed, while in Spain the level rises to more than 40%.

Gracias por visitar el sitio de Juantxo Cruz

SIN SOLUCIÓN, 2010-2011

Gracias por visitar el sitio de Juantxo Cruz

Tasa de DESEMPLEO JOVEN y variación entre 2005 y 2007.
How to read the figure? Denmark located in Quadrant C had a youth unemployment rate of 7.8% in 2005-07 and experienced a decrease of 1.9 percentage points of its rate compared with 1995-97.

Gracias por visitar el sitio de Juantxo Cruz

El desempleo joven en España dobla la tasa de los adultos.
How to read the figure? All countries above the «Equal» line have a higher youth unemployment rate than that of adults. For example in Sweden, youth have an unemployment rate that is more than four times that of adults compared with three times in Greece and twice in Japan

Gracias por visitar el sitio de Juantxo Cruz

Deterioro de la tasa
How to read the figure? The youth unemployment rate reached 43.5% in Spain (located in Quadrant B) in the fourth quarter of 2009, an increase of 24.7 percentage points since the fourth quarter of 2007.

Gracias por visitar el sitio de Juantxo Cruz

Paro y educación
% de jóvenes que encuentran trabajo.
High performers: En menos de seis meses después de dejar la educación. CON SUERTE.
Poorly-integrated: Entran y salen del mercado laboral, sin continuidad. MALO.
Left-Behind: cinco años desempleados. HORROROSO.
Returning to education: han trabajado, pero vuelven a los estudios para seguir su formación. MEJOR ESTO QUE NADA.

Box 2. School-to-work transition pathways of students having left secondary education
To account for the dynamic nature of youth labour market situations and identify the different pathways that youth can take after leaving secondary education, Quintini and Manfredi (2009) exploit monthly observations in the National Longitudinal Survey of Youth for the United States and the European Community Household Panel survey for Europe.
Figure A shows the share of youth in one of four key pathways identified by Quintini and Manfredi (2009). Over a five-year period after leaving education: «High performers» spend most of their time – 70% or more – in employment and take less than six months to find their first job after leaving school; «Poorly-integrated new entrants» move in and out of employment, unemployment, inactivity and sometimes education, signaling difficulties in settling on a promising career path; «Left-behind» youth spend most of the five years in unemployment or inactivity; «Returning to education» leave education for a spell on the labour market of varying length but ultimately return to complete high school – if they have dropped out before completion – or to attend tertiary education.
The United States has a significantly larger share of high performers than Europe and many more youth return to education after a spell out of work and studying.* As a result, the share of youth facing serious difficulties on the labour market –left behind and poorly-integrated new entrants – is 18 percentage points smaller in the United States than in Europe. In Europe, 30% of youth face difficulties settling into the labour market and another 15% are trapped in long-term unemployment or inactivity. On the other hand, in the United States, poor integration affects 21% of youth and the fact that long-term unemployment is uncommon reduces the share of youth Left Behind to just 6% of youth facing long-term inactivity.
!Gracias por visitar mi sitio! | Copyright © 1992- 2024 juantxo_cruz. Todos los derechos reservados.