17 de abril de 2010, NASA
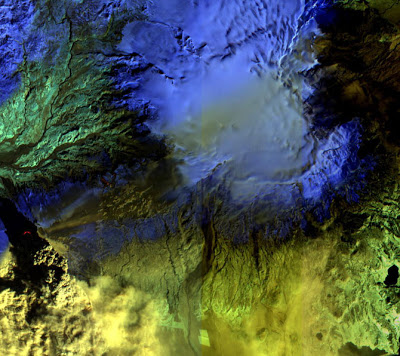
False-color infrared image of Iceland’s Eyjafjallajökull volcano acquired Sat., April 17, 2010, by the Advanced Land Imager (ALI) instrument onboard NASA’s Earth Observing-1 (EO-1) spacecraft. Strong thermal emissions, shown in red, are visible at the base of the ash plume and above and to the right from earlier lava flows located at Fimmvorduhals. Image credit: NASA/JPL/EO-1 Mission/GSFC/Ashley Davies
19 de abril, espectómetro
The Multi-angle Imaging SpectroRadiometer (MISR) instrument on NASA’s Terra satellite captured these different views of the ash plume from Iceland’s erupting Eyjafjallajökull volcano on April 19, 2010, which provide information on the amount and type of particles in the plume itself. Left: a true-color nadir (vertical) view; left-center: a map of retrieved aerosol optical depth, a measure of the amount of particulate matter in the atmosphere; right-center: the Angstrom exponent, which is related to average particle size; right: particle shape. Image credit: NASA/GSFC/LaRC/JPL, MISR Team
A computer-analyzed map of ash plume heights, corrected to compensate for the effects of wind. Reds are highest, blue lowest. Image credit: NASA/GSFC/LaRC/JPL, MISR Team
Photo-like satellite images give us a view of the world that is relatively familiar to us; the images look a lot like a digital photo. But for many scientific studies, a photo-like image doesn’t provide enough information. For example, to predict where the ash from an eruption may spread or how it might interact with clouds, scientists need a mathematical way to describe the concentration of particles in the air.
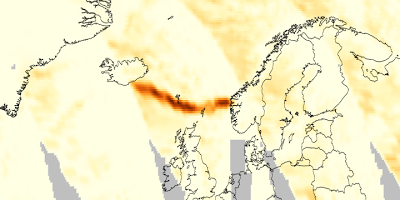
Cloud-Aerosol Lidar and Infrared Pathfinder Satellite Observations (CALIPSO) satellite watches Eyjafjallajökull’s plume drift over northern Europe. Credit: NASA/Kurt Severance and Tim Marvel
GERMAN AEROSPACE CENTER
Resultados del estudio realizado con un Falcon 20E para observar el impacto de las cenizas en el aparato.
Realizado el 19 de abril, publicado el 20.
La prueba fue satisfactoria, en Alemania.
No se apreciaron daños.
On 19 April 2010 the DLR ‘Falcon 20E’ research aircraft took off from Oberpfaffenhofen at 16:00 CEST to examine the ash cloud from the Icelandic volcano Eyafjallajoküll. The route for this measurement flight led from Oberpfaffenhofen to Leipzig, then over Hamburg and on to Bilthoven (the Netherlands) and returned via Stuttgart to Oberpfaffenhofen.
Figure 1: Flight route of the DLR Falcon on 19 April 2010
Figure 2: FLEXPART simulations of the time evolution of an aerosol tracer released from the Iceland volcano (release rate inferred from MSG observations) since 14 April 2010. Total columns (pmol/mol) on 16 April, 15 UTC (a), 17 April, 15 UTC (b), 18 April, 15 UTC, and 19 April, 17 UTC (conditions during the Falcon flight).
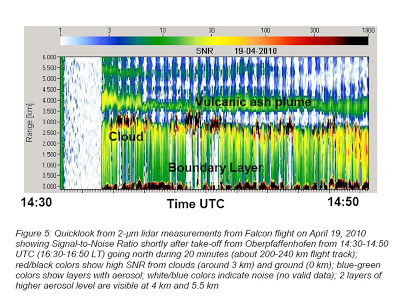
Figure 5: Quicklook from 2-μm lidar measurements from Falcon flight on April 19, 2010 showing Signal-to-Noise Ratio shortly after take-off from Oberpfaffenhofen from 14:30-14:50 UTC (16:30-16:50 LT) going north during 20 minutes (about 200-240 km flight track); red/black colors show high SNR from clouds (around 3 km) and ground (0 km); blue-green colors show layers with aerosol; white/blue colors indicate noise (no valid data); 2 layers of higher aerosol level are visible at 4 km and 5.5 km


